


QXO Inc Stock (QXO) Moved Down by 7.14% on Oct 19: Drivers Behind the Movement



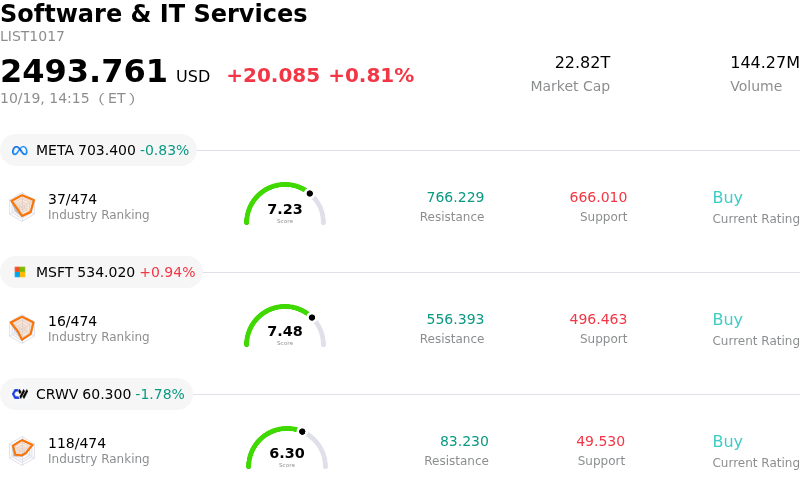
QXO Inc (QXO) moved down by 7.14%. The Software & IT Services sector is up by 0.81%. The company underperformed the industry. Top 3 stocks by turnover in the sector: Meta Platforms Inc (META) down 0.91%; Microsoft Corp (MSFT) up 0.94%; CoreWeave Inc (CRWV) down 1.78%.
What is driving QXO Inc (QXO)’s stock price down today?
Shares of QXO experienced notable downward volatility driven by a combination of macroeconomic headwinds in the residential housing market and growing market skepticism around the company's aggressive consolidation strategy. Broader weakness across the building materials distribution sector, stemming from elevated interest rates and persistent sluggishness in residential roofing and construction activities, has continued to weigh on overall demand. Sentiment was further pressured following recent sell-side analyst price target reductions and downward earnings estimate revisions, as industry channel checks pointed to softer-than-expected near-term transaction volumes.
From a fundamental standpoint, market participants remain focused on QXO's transition from a high-growth acquisition narrative to an operational execution story. Under its aggressive strategy of consolidating building products distributors, top-line revenue has expanded significantly. However, this rapid top-line growth has come at the expense of bottom-line profitability. Rising selling, general, and administrative expenses alongside elevated interest carrying costs tied to substantial long-term debt have depressed operating margins, keeping net earnings in negative territory. Consequently, investors are questioning the timeline required for synergetic cost efficiencies and margin expansion to materialize.
The intraday volatility reflects an ongoing recalibration of institutional portfolio positions. Given QXO's elevated valuation relative to current profitability and the execution risks inherent in integrating multiple large acquisitions simultaneously, sell-side downgrades and institutional profit-taking have outpaced buying interest. Until residential demand stabilizes and margin improvement becomes visible in quarterly operational results, QXO stock is likely to remain vulnerable to heightened volatility and elevated short-term selling pressure.
Technical Analysis of QXO Inc (QXO)
Technically, QXO Inc (QXO) shows a MACD (12,26,9) value of -0.113, indicating a sell signal. The RSI at 35.468 suggests neutral condition and the Williams %R at 99.402 suggests oversold condition. Please monitor closely.
Fundamental Analysis of QXO Inc (QXO)
QXO Inc (QXO) is in the Software & IT Services industry. Its latest annual revenue is $6.84B, ranking 48 in the industry. The net profit is $-388.30M, ranking 584 in the industry. Company Profile
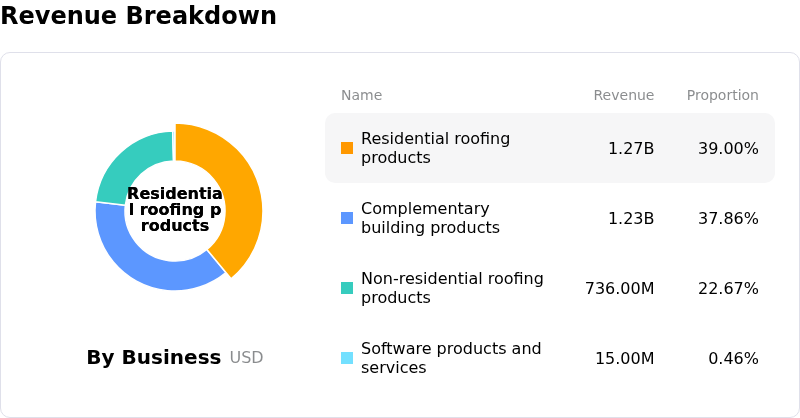
Over the past month, multiple analysts have rated the company as Buy, with an average price target of $24.69, a high of $36.00, and a low of $15.00.
More details about QXO Inc (QXO)
Company Specific Risks:
- Analyst Price Target Cuts and Sluggish Q3 Demand: Wall Street analysts, including RBC Capital, sharply reduced price targets on QXO from $27 to $18 after channel checks revealed weaker-than-expected third-quarter demand in core residential roofing and building product distribution, exacerbated by lagging inventory destocking across key channels.
- Severe M&A Integration and Operational Execution Risk: Aggressive multi-billion-dollar roll-up acquisitions—including Beacon Roofing, Kodiak Building Partners, and TopBuild—have created substantial integration friction and high overhead costs, driving quarterly operating expenses to $845 million and resulting in an operating loss.
- Surging Debt Burden and Balance Sheet Leverage: Long-term debt nearly doubled to over $6.0 billion, creating heavy debt-service obligations that heighten financial distress risks and raise potential equity dilution concerns during a high-interest-rate environment.
- Unprofitable Business Model and Margin Compression: Despite scaling quarterly revenues to $3.25 billion, QXO generated a net loss of $55 million (a negative net margin of ~5.17% and an EBIT margin of -3.5%), reflecting systemic profit erosion from high interest expenses and heavy SG&A burdens.
This article may include AI-generated content that is human-reviewed, which is for reference and general information purposes only and does not constitute investment advice.
Recommended Articles






Comments (0)
Click the $ button, enter the symbol, and select to link a stock, ETF, or other ticker.