


Broadcom Inc Stock (AVGO) Moved Up by 3.16% on Oct 19: Drivers Behind the Movement



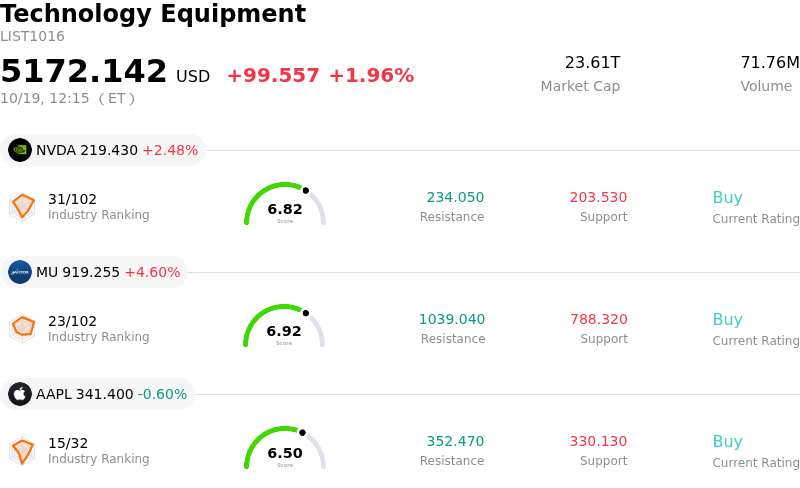
Broadcom Inc (AVGO) moved up by 3.16%. The Technology Equipment sector is up by 1.96%. The company outperformed the industry. Top 3 stocks by turnover in the sector: NVIDIA Corp (NVDA) up 2.48%; Micron Technology Inc (MU) up 4.60%; Apple Inc (AAPL) down 0.56%.
What is driving Broadcom Inc (AVGO)’s stock price up today?
Broadcom experienced an upward price trajectory characterized by significant intraday volatility as broader technology and semiconductor shares staged a relief rally. Investors stepped back into high-profile artificial intelligence hardware suppliers following recent selling pressure that had pushed valuations into temporary oversold territory. The price action reflected a broader shift in market sentiment across the tech sector, prompting dip-buyers to re-engage with leading silicon providers as broad market index futures advanced.
Underlying confidence was bolstered by ongoing positive analyst commentary and industry updates highlighting robust demand for custom application-specific integrated circuits. Wall Street research reiterated Broadcom's strategic dominance in custom accelerators designed for hyperscalers and frontier artificial intelligence developers, such as Alphabet, Meta, and OpenAI. Upbeat channel checks and positive coverage across the broader cloud infrastructure ecosystem reinforced expectations that capital expenditures among cloud giants remain committed to tailored hardware solutions.
Despite recent market swings, long-term institutional focus remains anchored on Broadcom's strong free cash flow generation, expanding operating margins, and secured manufacturing supply for next-generation custom silicon products. While market participants continue to balance rapid revenue growth expectations against capital financing costs and customer concentration risks, the price movement underscores how institutional buyers view pullback episodes in high-conviction infrastructure leaders as tactical accumulation opportunities.
Technical Analysis of Broadcom Inc (AVGO)
Technically, Broadcom Inc (AVGO) shows a MACD (12,26,9) value of -4.229, indicating a sell signal. The RSI at 41.315 suggests neutral condition and the Williams %R at 80.597 suggests oversold condition. Please monitor closely.
Media Coverage of Broadcom Inc (AVGO)
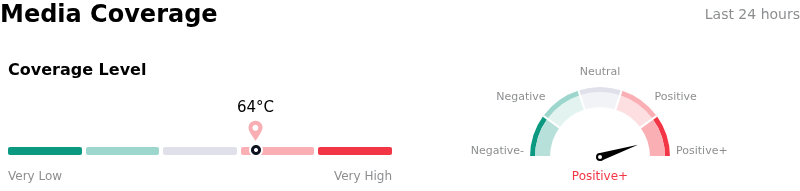
In terms of media coverage, Broadcom Inc (AVGO) shows a coverage score of 64, indicating a high level of media attention. The overall market sentiment index is currently in extremely bullish zone.
Fundamental Analysis of Broadcom Inc (AVGO)
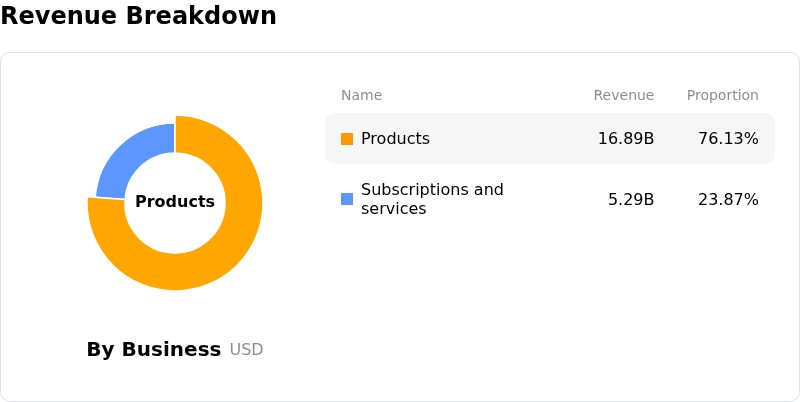
Broadcom Inc (AVGO) is in the Technology Equipment industry. Its latest annual revenue is $63.89B, ranking 5 in the industry. The net profit is $23.13B, ranking 5 in the industry. Company Profile
Over the past month, multiple analysts have rated the company as Buy, with an average price target of $514.92, a high of $663.00, and a low of $215.88.
More details about Broadcom Inc (AVGO)
Company Specific Risks:
- Executive Warnings on AI Capex and Financing Constraints: Cautions flagged by CEO Hock Tan regarding high financing costs and speculative AI capital spending have sparked institutional concern that key customers may curtail infrastructure buildouts, directly threatening Broadcom's custom silicon revenue targets.
- Financial Exposure to High-Stakes AI Client Deals: Broadcom's reported involvement in facilitating up to $60 billion in structured infrastructure financing for primary AI customers like Anthropic increases execution and credit risk, exposing the company to market volatility if client monetization or compute expansion slows.
- Custom Silicon Mix Shift and Gross Margin Compression: Rapid growth in lower-margin custom AI accelerators (XPUs) is structurally altering product mix relative to high-margin enterprise software (VMware), accelerating consolidated gross margin compression toward 74%.
- Technical Pattern Breakdown and Increased Put Skew: Heavy recent institutional distribution has pushed the stock below key moving averages into a technical "death cross" pattern, accompanied by a spike in 30-day implied volatility and elevated put option volume reflecting defensive institutional positioning.
This article may include AI-generated content that is human-reviewed, which is for reference and general information purposes only and does not constitute investment advice.
Recommended Articles








Comments (0)
Click the $ button, enter the symbol, and select to link a stock, ETF, or other ticker.