


Solana (SOLUSD) Is up 2.83% on Oct 19: What Do On-Chain Data and Market Sentiment Show?



Solana (SOLUSD) is up 2.83% at Oct 19 20:05(ET), now at $103.06, with a 7-day down of 4.10%.
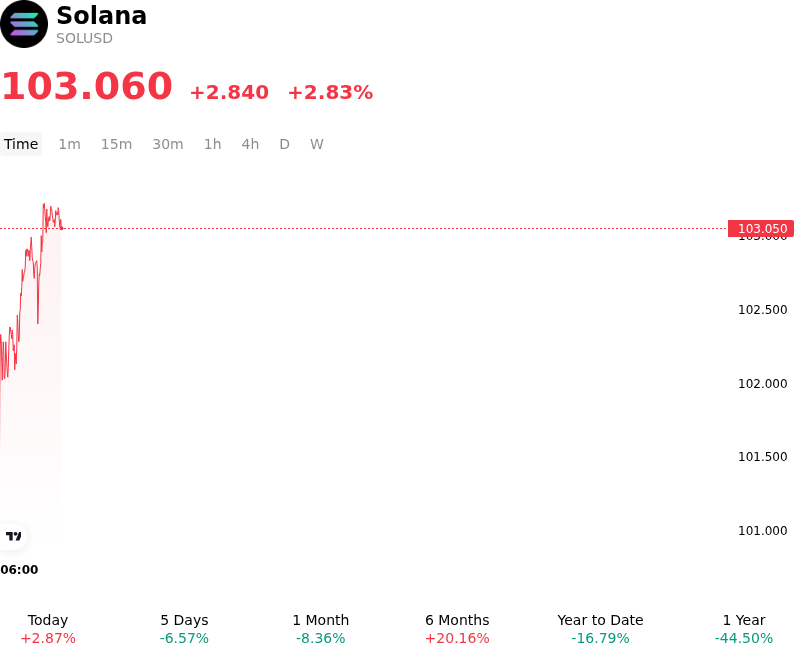
What is driving Solana (SOLUSD)’s stock price up today?
Capital flowed into Solana as the asset stabilized above key support levels, driven by a rebound in crypto market sentiment and institutional dip-buying interest following recent fund flow consolidation. A shift in derivatives positioning, characterized by short covering in perpetual futures markets and steady spot market accumulation, helped absorb overhead sell pressure. Improved market liquidity and renewed risk appetite across major digital asset trading venues supported the upward price action as market participants reassessed structural fundamentals.
Ecosystem fundamentals provided strong backing for the positive move, highlighted by significant expansion in real-world asset tokenization and enterprise payment infrastructure. Institutional engagement has been reinforced by strategic launches of tokenized equities and institutional investment funds on the Solana network, alongside expanded mobile integration for native stablecoin cross-border settlements. Furthermore, trader anticipation regarding core protocol efficiency upgrades aimed at significantly reducing transaction finality times has sustained long-term network throughput and adoption expectations among sophisticated allocators.
While today's capital inflows reflect constructive positioning around Solana's scaling roadmap and financial enterprise utility, institutional investors continue to evaluate broader market variables. Key factors being monitored include the stabilization of spot ETF flow dynamics, sustained decentralized exchange trading volume, and the flawless execution of upcoming network upgrades. Broader macroeconomic liquidity conditions, Federal Reserve monetary policy expectations, and overall crypto risk appetite remain key external determinants for sustained price trajectory.
Technical Analysis of Solana (SOLUSD)
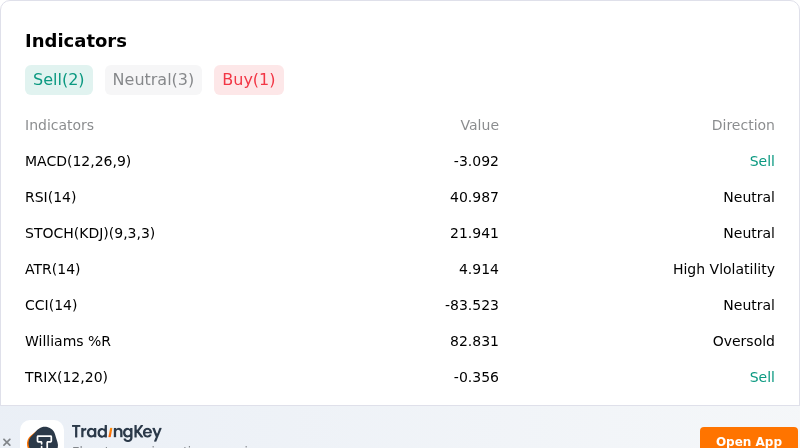
Technically, Solana (SOLUSD) shows a MACD (12,26,9) value of -3.092, indicating a sell signal. The RSI at 40.987 suggests neutral condition and the Williams %R at 82.831 suggests oversold condition. Please monitor closely.
More details about Solana (SOLUSD)
Recent Events and Risks:
- Institutional Spot ETF Redemptions: SOL-focused spot exchange-traded funds have recorded extended consecutive sessions of net redemptions, removing institutional buying support and reinforcing overhead supply pressure.
- Whale Exchange Inflows: On-chain tracking highlighted substantial single-wallet transfers exceeding 470,000 SOL (~$51M) onto centralized exchanges, elevating market concerns of imminent spot liquidations and holder exits.
- Derivatives Leverage Flush: Technical breakdowns below key support thresholds near the $107–$111 zone triggered widespread long-position liquidations across major derivatives venues, leaving SOL vulnerable to secondary cascade risks.
- Contraction in On-Chain Stablecoin Liquidity: Shrinking stablecoin capital across Solana-based decentralized exchanges has thinned liquidity buffers, increasing trade slippage and magnifying intraday downside volatility during risk-off periods.
This article may include AI-generated content that is human-reviewed, which is for reference and general information purposes only and does not constitute investment advice.
Recommended Articles









Comments (0)
Click the $ button, enter the symbol, and select to link a stock, ETF, or other ticker.