


XRP (XRPUSD) Is down 1.23% on Oct 16: Here Is Why



XRP (XRPUSD) is down 1.23% at Oct 16 11:05(ET), now at $1.3228, with a 7-day down of 4.79%.
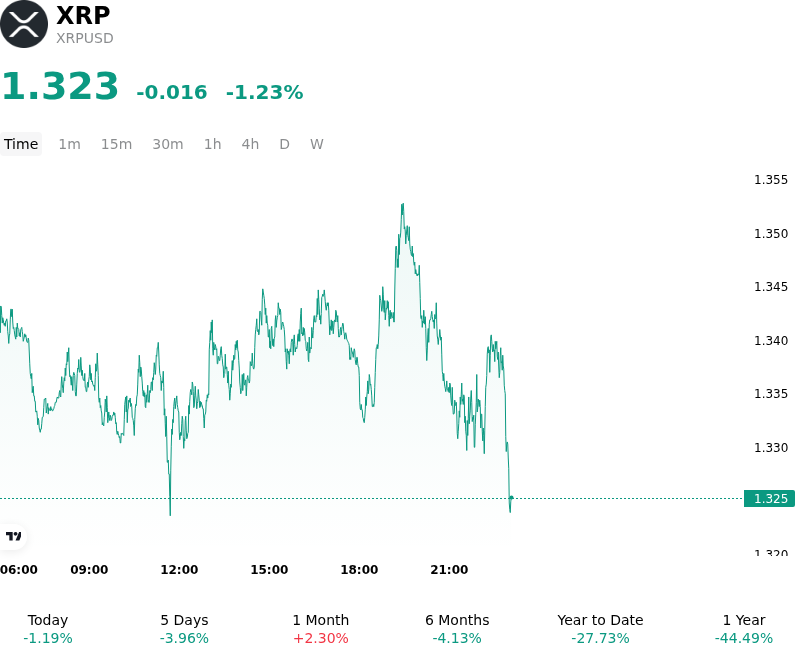
What is driving XRP (XRPUSD)’s stock price down today?
XRP experienced modest downward pressure as digital asset markets faced broader macroeconomic headwinds driven by persistent interest rate volatility and elevated US Treasury yields. Hawkish repricing following resilient economic data and sticky inflation readings reinforced expectations of restrictive Federal Reserve policy ahead of the upcoming Federal Open Market Committee meeting. Rising real yields have temporarily heightened the opportunity cost of holding non-yielding digital assets, prompting institutional investors to trim risk exposure across secondary altcoin markets. Concurrently, digital asset investment products registered net weekly outflows, dampening short-term spot liquidity for major tokens despite ongoing multi-week inflows into spot ETF vehicles.
From a market microstructure perspective, XRP consolidated around critical structural support levels near its 100-day Exponential Moving Average and major Fibonacci retracement pivots. Dynamic technical overhead, including stacked resistance from intermediate moving averages near higher psychological bounds, continues to limit upside follow-through. Technical indicators, such as a sub-50 Relative Strength Index and a negative MACD backdrop, reflect muted momentum and persistent selling pressure on relief rallies. Derivatives positioning indicates leverage remains relatively constrained compared to prior cycle peaks, with open interest lacking the expansion necessary to drive a sustained breakout without aggressive spot market buying.
Despite short-term price consolidation, underlying long-term adoption metrics and structural ecosystem developments remain constructive. Institutional focus remains anchored on the expansion of corporate treasury allocations, upcoming XRP Ledger protocol upgrades aimed at enhancing native lending functionality and smart contract capabilities, and strategic integrations within institutional banking and custody infrastructure. Market participants continue to monitor whether stabilizing broader risk sentiment, upcoming ecosystem events, and sustained spot ETF accumulation can absorb overhead liquidity resistance to establish a firmer price floor.
Technical Analysis of XRP (XRPUSD)
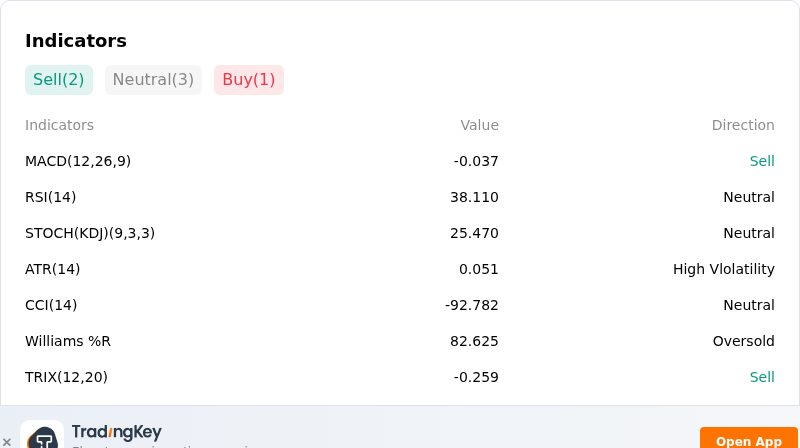
Technically, XRP (XRPUSD) shows a MACD (12,26,9) value of -0.037, indicating a sell signal. The RSI at 38.110 suggests neutral condition and the Williams %R at 82.625 suggests oversold condition. Please monitor closely.
More details about XRP (XRPUSD)
Recent Events and Risks:
- Concentrated Derivatives Long Positioning & Liquidation Risk: Exchange derivatives data highlights that over 97% of net-long futures contracts were established above $1.31, leaving leveraged buyers highly exposed to forced liquidation flushes and downside cascades if prices break below critical technical supports.
- Surging On-Chain Exchange Deposits: On-chain monitoring reveals a multi-month peak in whale activity, with over 1.66 billion XRP deposited onto exchange wallets like Binance over the past 30 days, heightening market fears of expanding liquid supply and potential institutional sell-side pressure.
- Deceleration in Institutional ETF Inflows: Net capital inflows into U.S. spot XRP exchange-traded products have slowed significantly, causing overall assets under management to shrink and leaving spot order books thinner and less capable of absorbing sell orders.
- Macro Risk-Off and Technical Moving Average Breakdown: Hotter-than-expected U.S. CPI inflation figures accelerated broad risk-off sentiment, pushing XRP below its converged 50-day and 200-day moving average cluster near $1.39–$1.40 and increasing the risk of a breakdown toward lower support levels near $1.25.
This article may include AI-generated content that is human-reviewed, which is for reference and general information purposes only and does not constitute investment advice.
Recommended Articles









Comments (0)
Click the $ button, enter the symbol, and select to link a stock, ETF, or other ticker.