


Novartis AG Stock (NVS) Moved Up by 3.00% on Oct 15: Drivers Behind the Movement



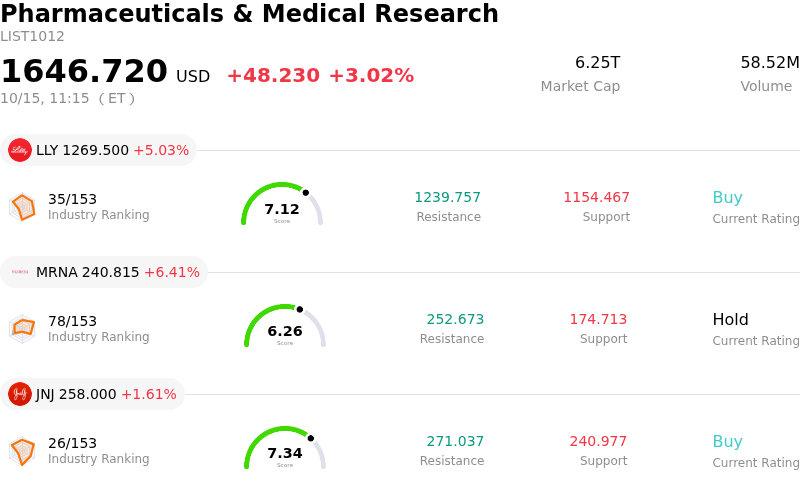
Novartis AG (NVS) moved up by 3.00%. The Pharmaceuticals & Medical Research sector is up by 3.02%. The company underperformed the industry. Top 3 stocks by turnover in the sector: Eli Lilly and Co (LLY) up 5.03%; Moderna Inc (MRNA) up 6.68%; Johnson & Johnson (JNJ) up 1.71%.
What is driving Novartis AG (NVS)’s stock price up today?
Novartis AG experienced positive upward momentum as strong regulatory catalysts and expanded clinical applications for its core pipeline candidates buoyed investor confidence. The primary catalyst behind the buying interest stems from recent regulatory progress in its immunology and neuroscience portfolios, notably the Food and Drug Administration approval for Rhapsido in treating symptomatic dermographism. This label expansion, combined with encouraging late-stage clinical data for remibrutinib in relapsing multiple sclerosis, reassures the market regarding the company's ability to drive multi-indication growth across high-margin therapeutic areas.
Beyond regulatory wins, strategic corporate transactions and pipeline development efforts have bolstered market sentiment. The company's recent expansion into advanced RNA therapeutics and continuous investment in global healthcare infrastructure demonstrate strategic discipline in replenishing its drug development pipeline. These growth initiatives help offset earlier concerns regarding selective late-stage trial hiccups, signaling to institutional investors that core commercial operations remain resilient and well-diversified across primary therapy categories.
Institutional positioning ahead of the upcoming third-quarter earnings announcement has also contributed to the favorable buying activity. Market participants are recalibrating portfolios toward high-quality, defensive healthcare equities that offer steady dividend yields, solid balance sheet strength, and reliable cash generation. As broader equity markets navigate macroeconomic shifts, institutional capital inflows into large-cap pharmaceutical leaders like Novartis reflect a strategic rotation toward visible mid-to-long-term earnings stability.
Technical Analysis of Novartis AG (NVS)
Technically, Novartis AG (NVS) shows a MACD (12,26,9) value of 2.319, indicating a neutral signal. The RSI at 63.386 suggests neutral condition and the Williams %R at 3.929 suggests overbought condition. Please monitor closely.
Fundamental Analysis of Novartis AG (NVS)
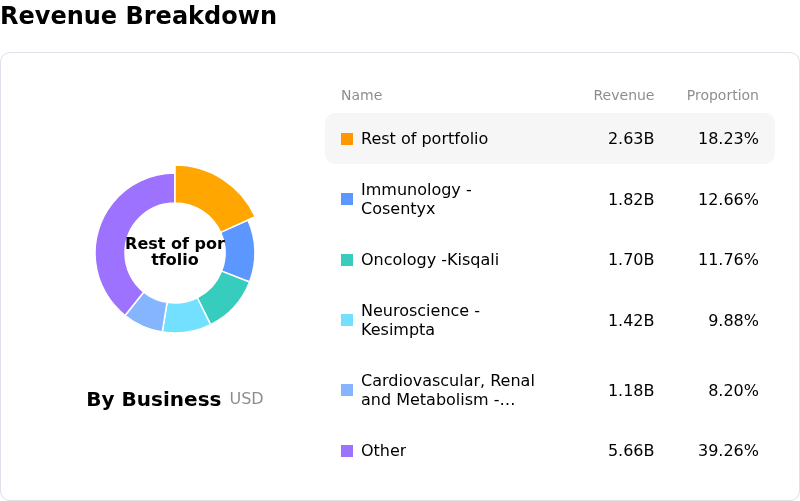
Novartis AG (NVS) is in the Pharmaceuticals & Medical Research industry. Its latest annual revenue is $56.33B, ranking 9 in the industry. The net profit is $13.98B, ranking 5 in the industry. Company Profile
Over the past month, multiple analysts have rated the company as Hold, with an average price target of $153.26, a high of $185.00, and a low of $121.16.
More details about Novartis AG (NVS)
Company Specific Risks:
- Litigation and Securities Fraud Scrutiny: Active investigations launched by investor rights law firms regarding potential misleading statements surrounding failed Phase III trials create legal liabilities and class-action risks for executive management.
- Late-Stage Clinical Pipeline Setbacks: Recent back-to-back Phase III trial failures—including del-desiran for myotonic dystrophy and pelacarsen for cardiovascular disease—have derailed near-term commercialization targets and diminished revenue replacement opportunities.
- M&A Execution and Capital Allocation Pressure: Underperforming deal return metrics on major buyouts, such as the $12 billion Avidity acquisition, have triggered institutional shareholder pushback and forced the company toward early-stage licensing structures that lack immediate revenue predictability.
- Technical Deterioration and Sell-Side Cautions: The stock recently generated a bearish technical signal as its 50-day moving average crossed below its 200-day moving average, which, combined with analyst downgrades to Hold ratings, has driven institutional order flow toward a heavy sell bias.
This article may include AI-generated content that is human-reviewed, which is for reference and general information purposes only and does not constitute investment advice.
Recommended Articles








Comments (0)
Click the $ button, enter the symbol, and select to link a stock, ETF, or other ticker.