


Ethereum (ETHUSD) Is down 2.62% on Oct 15: What Do On-Chain Data and Market Sentiment Show?



Ethereum (ETHUSD) is down 2.62% at Oct 15 22:25(ET), now at $2350.8, with a 7-day down of 4.92%.
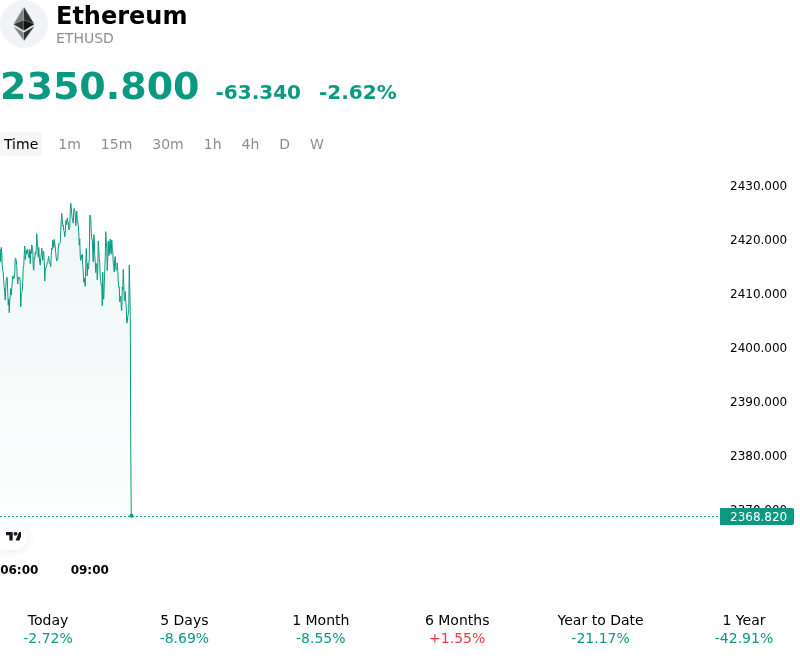
What is driving Ethereum (ETHUSD)’s stock price down today?
Hotter-than-expected U.S. inflation data repriced global monetary policy expectations, triggering a broad retrenchment from risk-sensitive assets, including Ether. Rising U.S. Treasury yields and a strengthening U.S. Dollar Index effectively tightened global fiat liquidity conditions, raising the opportunity cost of holding non-yielding digital assets. This macro-driven risk-off impulse led institutional macro desks to scale down high-beta allocations, placing immediate downward pressure on spot crypto valuations.
Compounding macro headwinds, institutional capital flows through U.S. spot Ether exchange-traded funds extended a series of net redemptions. The persistent outflow from spot funds removed a critical structural market-clearing bid, leaving order books vulnerable to downside volatility. Concurrently, market sentiment was tempered by indications that major corporate treasury accumulators are nearing self-imposed supply allocation limits, prompting traders to re-evaluate the sustainability of corporate spot accumulation in the near term.
On-chain and market structure dynamics further amplified the downside move. Moderating network gas consumption and lower transaction fees temporarily slowed the rate of ETH supply burns, dampening the asset's structural supply-reduction narrative. As spot prices slipped through key short-term moving averages and psychological support zones, automated liquidations of leveraged long positions surged across major derivative exchanges. This forced deleveraging created short-term order book imbalances and exacerbated price slippage amidst thinned liquidity.
Overall, the intraday movement represents a combination of macro liquidity repricing, softening institutional ETF flows, and derivative long liquidations rather than a fundamental breakdown in Ethereum's underlying network utility. Institutional market participants continue to monitor upcoming Federal Reserve policy communications, spot ETF flow trends, and leverage reset signals across derivatives markets to gauge short-term market stabilization.
Technical Analysis of Ethereum (ETHUSD)
Technically, Ethereum (ETHUSD) shows a MACD (12,26,9) value of -64.379, indicating a sell signal. The RSI at 34.380 suggests neutral condition and the Williams %R at 98.634 suggests oversold condition. Please monitor closely.
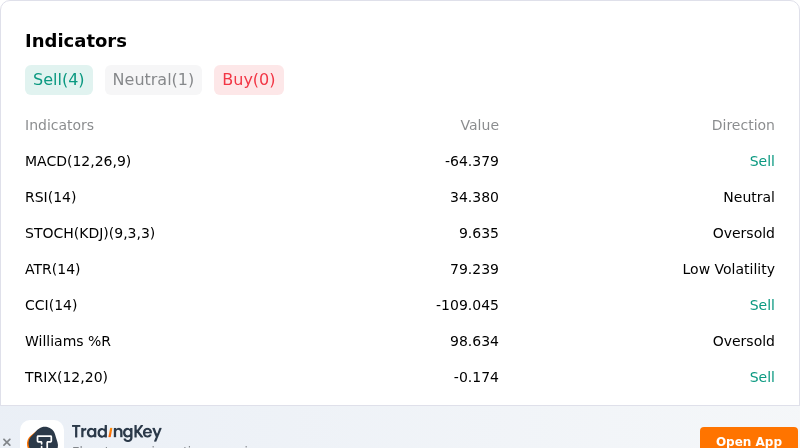
More details about Ethereum (ETHUSD)
Recent Events and Risks:
- Sustained Institutional ETF Outflows: Spot Ethereum exchange-traded funds experienced a ten-day streak of net capital outflows exceeding $500 million, signaling persistent weakness in spot demand and removing key structural buying support.
- Derivatives Leverage & Liquidation Vulnerability: Forced liquidations of leveraged long positions have repeatedly triggered intraday declines, with concentrated derivative stop-loss clusters below key support levels exposing the market to further cascading unwinds.
- Macro Pressure from Rising Yields and USD Strength: Hotter inflation indicators pushed U.S. 10-year Treasury yields and the U.S. Dollar Index (DXY) higher, generating broad risk-off sentiment that disproportionately drags down altcoins like Ether.
- Heightened Exchange On-Chain Spikes: Spikes in Ethereum net transfers onto centralized exchanges suggest growing intent among large holders to sell, compounding downside risks amid broader equities market volatility.
This article may include AI-generated content that is human-reviewed, which is for reference and general information purposes only and does not constitute investment advice.
Recommended Articles









Comments (0)
Click the $ button, enter the symbol, and select to link a stock, ETF, or other ticker.