


Platinum (XPTUSD) Surges on Oct 9: What Lie behind the Move?



Platinum (XPTUSD) is up 2.00% at Oct 9 22:00(ET), now at $1675.02, with a 7-day down of 1.52%.
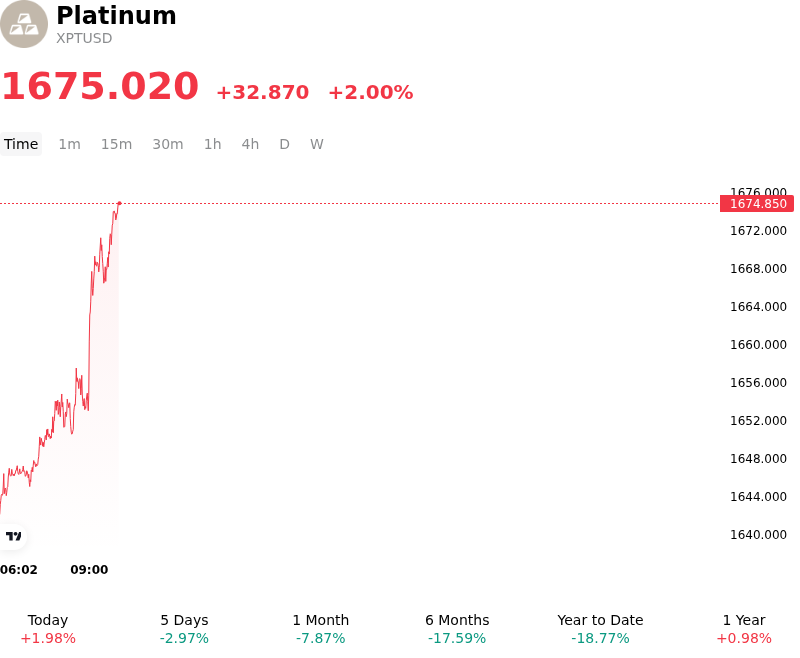
What is driving Platinum (XPTUSD)’s stock price up today?
Spot platinum advanced as a confluence of macroeconomic tailwinds and underlying physical supply constraints spurred systematic short-covering and renewed institutional allocation across the precious metals complex. The primary impetus for the upward movement was a pull-back in U.S. Treasury yields alongside a softening U.S. dollar. As market expectations surrounding Federal Reserve monetary policy recalibrated in response to softer macroeconomic indicators, real yields receded, reducing the opportunity cost of holding non-yielding assets. The weaker greenback simultaneously enhanced the affordability of dollar-denominated physical metals for international buyers, prompting macro funds to rebuild long exposures.
Beyond broad macroeconomic drivers, persistent supply-side vulnerabilities provided fundamental backing for the advance. Primary mine supply remains structurally constrained in top-producing regions, most notably South Africa, where operational disruptions, power availability issues, elevated deep-level extraction costs, and infrastructure bottlenecks continue to restrict refined metal output. Furthermore, deliverable inventory levels across major global exchanges have experienced significant drawdowns, leaving physical buffers exceptionally thin and heightening market sensitivity to sudden spot buying.
From a demand perspective, while automotive catalyst consumption faces broader cyclical shifts, resilient industrial utilization across glass manufacturing, chemical processing, and clean technology applications provided a steady floor. Long-term structural interest tied to hydrogen economy infrastructure continues to attract strategic capital, encouraging investors to treat recent valuation pullbacks as favorable entry points. Combined with technical support holding at key price levels, these factors drove strong intraday capital inflows, steering the market toward a broader supply-demand repricing.
Technical Analysis of Platinum (XPTUSD)
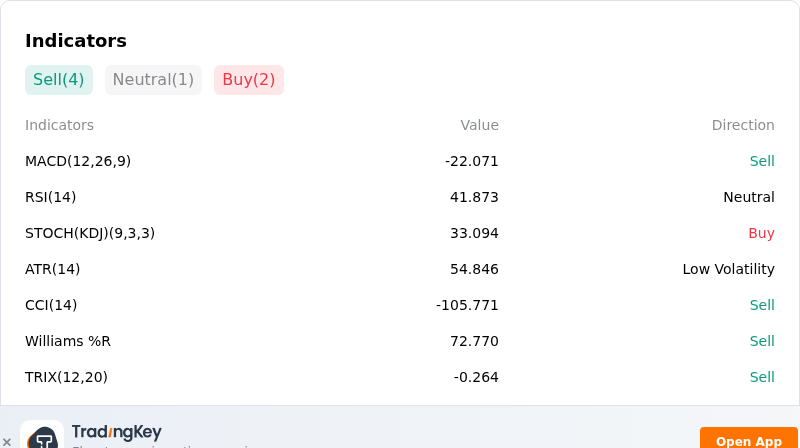
Technically, Platinum (XPTUSD) shows a MACD (12,26,9) value of -22.071, indicating a sell signal. The RSI at 41.873 suggests neutral condition and the Williams %R at 72.770 suggests sell condition. Please monitor closely.
More details about Platinum (XPTUSD)
Recent Events and Risks:
- Projected Market Surplus and Demand Downgrades: Industry forecasts, including updated projections from the World Platinum Investment Council, highlight an emerging market surplus of 265,000 ounces for 2026—reversing prior multi-year structural deficits—driven by an estimated 18% total demand contraction and sharp double-digit drops in Chinese jewelry consumption.
- Automotive Offtake Weakness and EV Market Penetration: Decelerating global light-vehicle production data alongside accelerating market adoption of battery electric vehicles (BEVs) continues to erode long-term autocatalyst demand for platinum group metals, putting sustained downside pressure on physical metal consumption.
- Macroeconomic Pressure from U.S. Dollar Strength: Periods of rebound in the U.S. Dollar index and elevated U.S. real Treasury yields increase the opportunity cost of holding non-yielding precious metals, triggering macro fund liquidations and suppressing intraday buying interest across spot XPTUSD markets.
- Technical Momentum Breakdown and Systematic Selling: XPTUSD price action has experienced severe intraday selling pressure that broke through key 20-day, 50-day, and 200-day moving average support levels, leaving momentum indicators heavily oversold and exposing the metal to stop-loss execution and speculative long unwinding.
This article may include AI-generated content that is human-reviewed, which is for reference and general information purposes only and does not constitute investment advice.
Recommended Articles












Comments (0)
Click the $ button, enter the symbol, and select to link a stock, ETF, or other ticker.