


Palladium (XPDUSD) Surges on Oct 9: What Lie behind the Move?



Palladium (XPDUSD) is up 2.02% at Oct 9 21:25(ET), now at $1147.85, with a 7-day down of 1.79%.
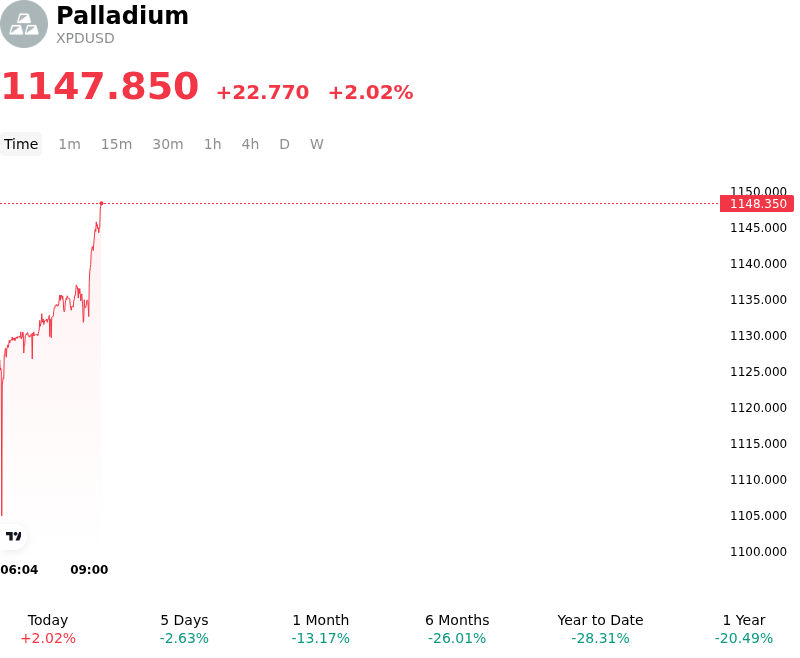
What is driving Palladium (XPDUSD)’s stock price up today?
The upward movement in palladium spot prices was primarily catalyzed by a softening macro environment alongside intensive institutional short-covering. A pullback in U.S. Treasury yields and a modest retreat in the U.S. Dollar Index reduced the opportunity cost of holding non-yielding precious and industrial metals. This macroeconomic relief provided a favorable window for systematic traders to cover bearish bets, particularly as palladium had been trading near the lower boundary of its multi-month range under heavily oversold technical conditions.
From a fundamental supply-demand perspective, physical market dynamics continue to establish a firm valuation floor. Operational constraints and declining head grades across key primary producing regions have kept global mine supply constrained. On the demand side, while long-term structural concerns around electric vehicle adoption persist, near-term industrial consumption remains supported by steady internal combustion and hybrid vehicle catalytic converter manufacturing. The interaction between tightly held physical inventories and stretched speculative short positioning amplified the upside repricing during the session.
Institutional market participants view the move as a tactical short-squeeze and valuation rebound within a broader range-bound regime rather than a definitive structural trend shift. Looking forward, investors continue to monitor real yield trajectories, global automotive assembly volumes, potential substitution risks between palladium and platinum, and supply discipline among major producers to evaluate the durability of current price levels.
Technical Analysis of Palladium (XPDUSD)
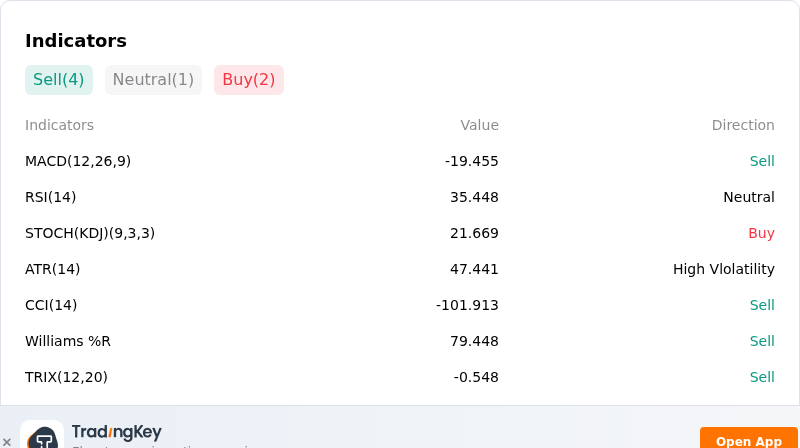
Technically, Palladium (XPDUSD) shows a MACD (12,26,9) value of -19.455, indicating a sell signal. The RSI at 35.448 suggests neutral condition and the Williams %R at 79.448 suggests sell condition. Please monitor closely.
More details about Palladium (XPDUSD)
Recent Events and Risks:
- Structural Automotive Demand Deterioration: Accelerating global adoption of battery electric vehicles and slowing production of traditional gasoline-powered cars continue to erode primary demand for catalytic converters, placing sustained downward pressure on spot palladium prices.
- Automotive Platinum Substitution: Ongoing technical substitution of palladium with lower-cost platinum in gasoline exhaust systems, alongside manufacturer efforts to thrift precious metal loadings per vehicle, compounds physical demand weakness across key global automotive hubs.
- Secondary Supply Expansion and Market Surplus Risk: Growing volumes of recycled auto-catalyst scrap paired with steady primary mining output are increasingly offsetting output constraints in South Africa and Russia, driving institutional forecasts toward a market surplus and limiting price recovery elasticity.
- Macroeconomic Headwinds and Yield Pressure: Sustained strength in the U.S. dollar and elevated real Treasury yields increase the holding cost of non-yielding physical assets, triggering systematic liquidations and leaving futures contracts vulnerable to technical breakdowns below major support levels.
This article may include AI-generated content that is human-reviewed, which is for reference and general information purposes only and does not constitute investment advice.
Recommended Articles











Comments (0)
Click the $ button, enter the symbol, and select to link a stock, ETF, or other ticker.