


Home Depot Inc Stock (HD) Moved Up by 3.13% on Oct 8: What Signal Does It Send?



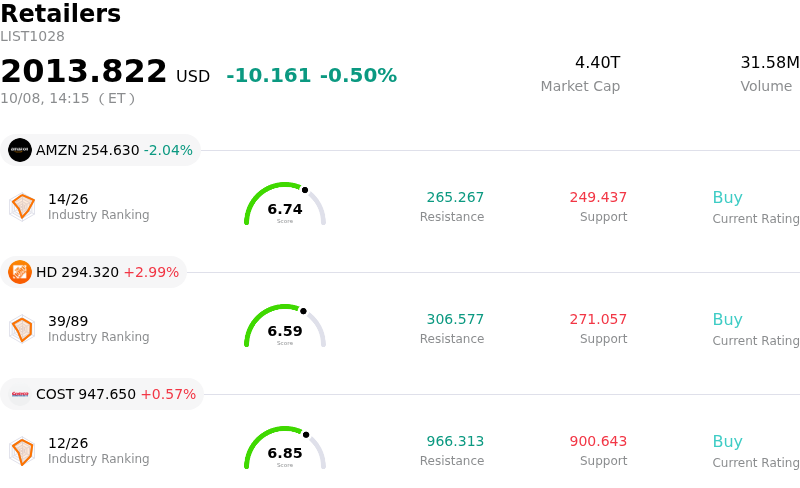
Home Depot Inc (HD) moved up by 3.13%. The Retailers sector is down by 0.50%. The company outperformed the industry. Top 3 stocks by turnover in the sector: Amazon.com Inc (AMZN) down 2.06%; Home Depot Inc (HD) up 2.99%; Costco Wholesale Corp (COST) up 0.57%.
What is driving Home Depot Inc (HD)’s stock price up today?
The upward movement in Home Depot's stock was primarily propelled by positive institutional research momentum and renewed investor interest in discounted high-quality value names. Wall Street analysts recently highlighted a long-term turnaround narrative for the home improvement sector, driven by an expected multi-year inflection in existing home inventory and deferred repair and remodeling projects. Following a period of selling pressure that compressed the stock's forward earnings multiple to attractive multi-month lows, institutional buyers stepped in to capitalize on the valuation disconnect, recognizing the retailer's durable competitive moat.
Underpinning this sentiment is the company's fundamental stability and execution. Home Depot recently reaffirmed its full-year financial outlook, reassuring investors that top-line performance remains on track despite elevated mortgage rates weighing on consumer discretionary spending. The retailer's growing momentum in its professional contractor business, reinforced by strategic investments in specialty distribution networks, continues to provide a resilient revenue foundation that buffers against softer DIY retail demand.
Broader market dynamics also contributed to intraday buying interest. While macroeconomic uncertainty and interest rate volatility triggered swings across equity indexes, capital flowed into mature mega-cap leaders offering strong balance sheets and consistent cash flow generation. Home Depot's solid dividend profile and status as a bellwether for home-related spending made it a prime beneficiary of selective dip-buying and sector rotation, allowing the stock to post strong gains and outperform wider retail benchmarks during the session.
Technical Analysis of Home Depot Inc (HD)
Technically, Home Depot Inc (HD) shows a MACD (12,26,9) value of 1.963, indicating a neutral signal. The RSI at 44.727 suggests neutral condition and the Williams %R at 40.672 suggests buy condition. Please monitor closely.
Media Coverage of Home Depot Inc (HD)
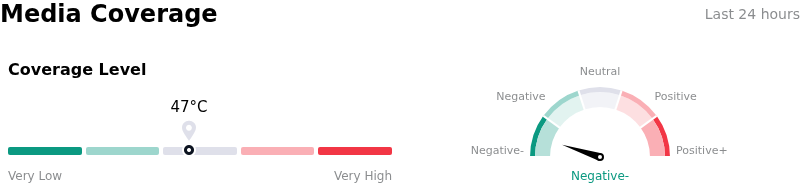
In terms of media coverage, Home Depot Inc (HD) shows a coverage score of 47, indicating a moderate level of media attention. The overall market sentiment index is currently in extremely bearish zone.
Fundamental Analysis of Home Depot Inc (HD)
Home Depot Inc (HD) is in the Retailers industry. Its latest annual revenue is $164.68B, ranking 1 in the industry. The net profit is $14.16B, ranking 1 in the industry. Company Profile
Over the past month, multiple analysts have rated the company as Buy, with an average price target of $373.64, a high of $425.00, and a low of $255.00.
More details about Home Depot Inc (HD)
Company Specific Risks:
- Macroeconomic Housing Lock-in and Rate Sensitivity: Persistent pressure from elevated Treasury yields and 30-year mortgage rates remaining near 7.4% has pinned US home turnover near historic lows, directly suppressing consumer demand for big-ticket remodeling and discretionary DIY projects.
- Margin Dilution from Specialty Pro Acquisitions: Aggressive strategic expansion to capture the professional contractor market through acquisitions like SRS Distribution and GMS is causing operating margin drag and return-on-capital dilution through fiscal 2026.
- Free Cash Flow Contraction and Stagnant Outlook: Full-year free cash flow contracted by over 22% alongside unchanged full-year guidance, reinforcing institutional analyst concerns over flat underlying volume growth and lack of near-term operational acceleration.
- Sustained Executive Insider Disposals: Institutional sentiment remains under pressure following notable net insider selling by key executive leadership, adding downside momentum as the stock hovers near its 52-week low.
This article may include AI-generated content that is human-reviewed, which is for reference and general information purposes only and does not constitute investment advice.
Recommended Articles









Comments (0)
Click the $ button, enter the symbol, and select to link a stock, ETF, or other ticker.