


Intel Corp Stock (INTC) Moved Down by 3.28% on Oct 8: What Signal Does It Send?



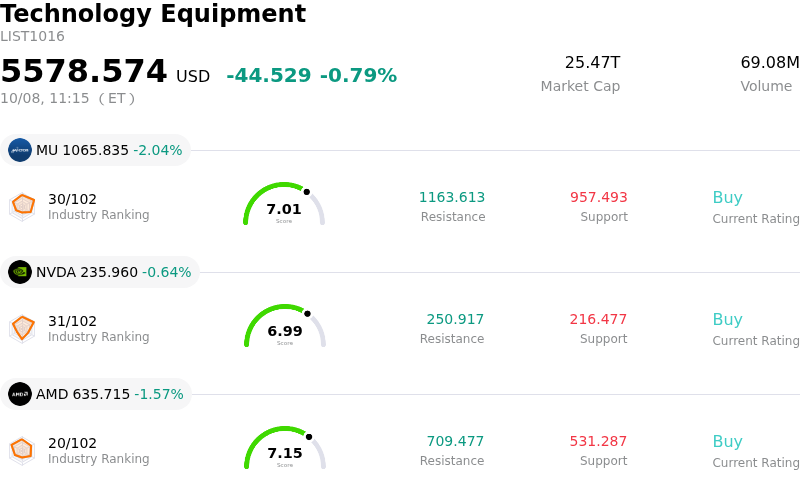
Intel Corp (INTC) moved down by 3.28%. The Technology Equipment sector is down by 0.79%. The company underperformed the industry. Top 3 stocks by turnover in the sector: Micron Technology Inc (MU) down 2.04%; NVIDIA Corp (NVDA) down 0.56%; Advanced Micro Devices Inc (AMD) down 1.57%.
What is driving Intel Corp (INTC)’s stock price down today?
Intel Corporation faced downward market pressure driven primarily by headline volatility surrounding its foundry role in major AI infrastructure initiatives. Recent reports regarding high-profile project partners, such as Elon Musk's Terafab effort, engaging in discussions with external foundries like Taiwan Semiconductor Manufacturing Co., sparked investor concern over potential dilution in Intel's manufacturing commitments. While corporate leadership attempted to reassure the market about Intel's ongoing strategic role, the uncertainty raised fresh questions about the company's external foundry customer pipeline, which remains critical to validating its aggressive capital expenditure strategy.
Beyond headline risk, the retreat reflects profit-taking and momentum digestion following an extended multi-week rally. Having surged significantly through late September on optimism surrounding server CPU demand and turnaround progress, the stock became increasingly vulnerable to short-term pullbacks. Traders capitalized on headline volatility to lock in gains, particularly as valuation multiples expanded relative to near-term earnings power. With operational losses in its foundry division still weighing on fundamental metrics, elevated expectations left little buffer for sentiment fluctuations.
Operational considerations and broader semiconductor dynamics further compounded the day's weakness. Investors continue to scrutinize the trajectory of gross margins ahead of upcoming quarterly earnings, as margin expansion shows signs of slowing amid heavy capital investment and early costs tied to advanced node ramps. Additionally, persistent competitive pressure in data center CPUs and broader tech market softness created an unfavorable backdrop, causing investors to re-evaluate short-term risk against long-term turnaround potential.
Technical Analysis of Intel Corp (INTC)
Technically, Intel Corp (INTC) shows a MACD (12,26,9) value of -2.864, indicating a neutral signal. The RSI at 47.948 suggests neutral condition and the Williams %R at 96.930 suggests oversold condition. Please monitor closely.
Media Coverage of Intel Corp (INTC)
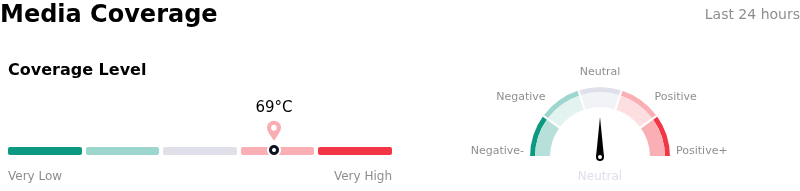
In terms of media coverage, Intel Corp (INTC) shows a coverage score of 69, indicating a high level of media attention. The overall market sentiment index is currently in neutral zone.
Fundamental Analysis of Intel Corp (INTC)
Intel Corp (INTC) is in the Technology Equipment industry. Its latest annual revenue is $52.85B, ranking 6 in the industry. The net profit is $-267.00M, ranking 111 in the industry. Company Profile
Over the past month, multiple analysts have rated the company as Hold, with an average price target of $116.57, a high of $200.00, and a low of $80.00.
More details about Intel Corp (INTC)
Company Specific Risks:
- Foundry Commercialization & Client Diversification Deficit: Recent disclosures revealing that Elon Musk's Terafab venture is in active negotiations with TSMC for a dedicated chip facility have diminished market expectations of Intel securing the marquee manufacturing contract, exposing the slow external commercial adoption of Intel Foundry's 18A and 14A nodes.
- Capital Expenditure Burden & Gross Margin Stagnation: Accelerated capital expenditures projected to top $20 billion in 2026 are inflating depreciation costs and leverage risk, while memory input cost headwinds threaten to cap sequential gross margin recovery near management's conservative 42% quarterly target.
- Core Server CPU Market Share Loss: Ongoing market share erosion in the data center and server CPU markets to main competitors like AMD continues to compress segment operating leverage, while over 90% of reported foundry revenue remains heavily dependent on Intel's internal product divisions rather than third-party accounts.
- Turnaround Valuation Multiples & Intraday Profit-Taking: Following a rapid multi-week rally into the $120–$126 range, aggressive short-term profit-taking has amplified price volatility, as negative trailing net profit margins leave the equity vulnerable to sharp pullbacks when growth execution faces headline friction.
This article may include AI-generated content that is human-reviewed, which is for reference and general information purposes only and does not constitute investment advice.
Recommended Articles









Comments (0)
Click the $ button, enter the symbol, and select to link a stock, ETF, or other ticker.