


Solana (SOLUSD) Suddenly Goes down 1.12% on Oct 8: What's Driving This



Solana (SOLUSD) is down 1.12% at Oct 8 00:20(ET), now at $113.91, with a 7-day down of 2.76%.
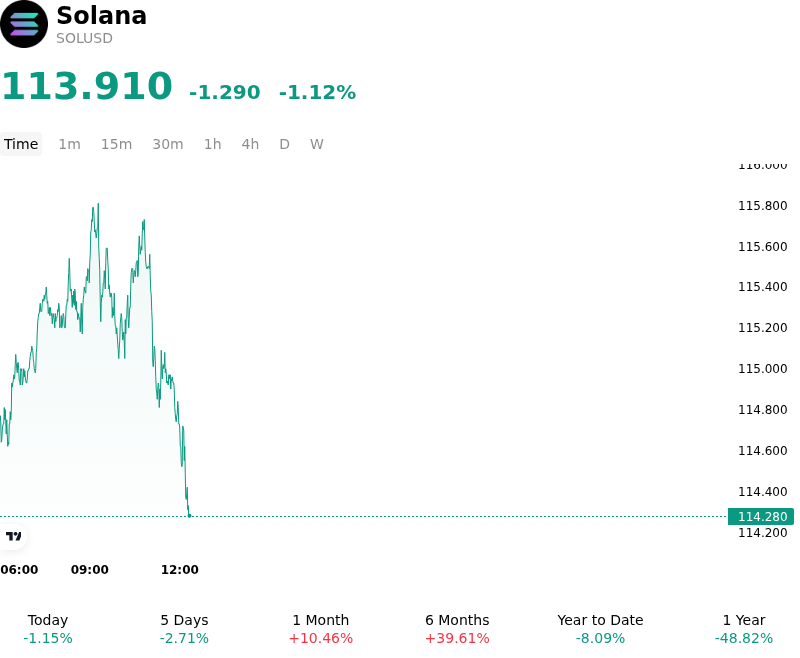
What is driving Solana (SOLUSD)’s stock price down today?
The modest decline in Solana reflects a broader risk-off mood across the digital asset space, driven primarily by macroeconomic tightening and sector-wide derivatives liquidations. Shifting liquidity conditions, elevated Treasury yields, and pre-event positioning ahead of upcoming U.S. economic data created a cautious environment for risk assets. As leveraged long positions were flushed out across major crypto trading venues, selling pressure spread into top-tier altcoins, causing capital to systematically retreat from active market exposure.
Despite the softer price action, asset-specific fundamentals remain anchored by significant enterprise and network milestones. Solana continues to expand its real-world payments narrative, supported by major distribution partnerships aimed at integrating native stablecoin transfers directly into consumer wallet ecosystems, alongside technical upgrades to reduce network slot times and enhance transaction finality. However, intraday price action in high-beta layer-one assets is frequently governed by macro liquidity flows and derivative positioning, which temporarily overshadowed positive long-term adoption catalysts during the trading session.
From an institutional perspective, the pull-back appears to be a temporary, liquidity-driven consolidation within a broader market digestion phase rather than a fundamental shift in Solana's structural trajectory. Institutional market participants continue to monitor macro risk factors, particularly Federal Reserve policy expectations and real yield movements, alongside crypto-native leverage dynamics. Future price trajectory will likely depend on whether upcoming macroeconomic catalysts restore broader risk sentiment and allow enterprise integration metrics to translate into sustained on-chain capital inflows.
Technical Analysis of Solana (SOLUSD)
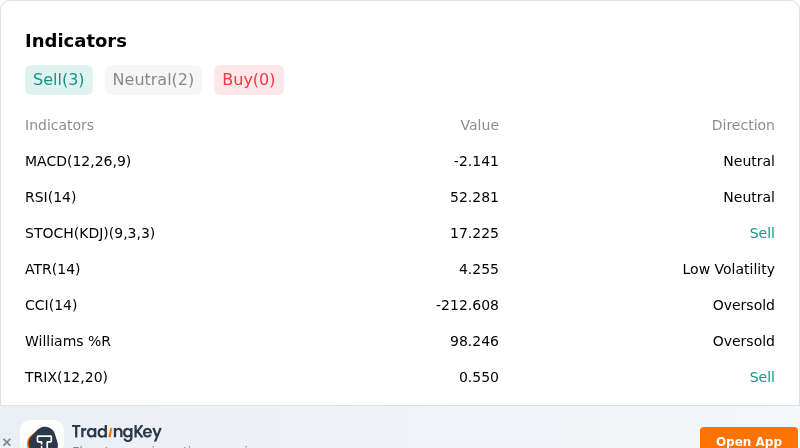
Technically, Solana (SOLUSD) shows a MACD (12,26,9) value of -2.141, indicating a neutral signal. The RSI at 52.281 suggests neutral condition and the Williams %R at 98.246 suggests oversold condition. Please monitor closely.
More details about Solana (SOLUSD)
Recent Events and Risks:
- Derivatives Long Liquidation Flush: A broad market deleveraging cascade over the past 48 hours triggered over $600 million in leveraged long liquidations across digital asset exchanges, disproportionately pressuring high-beta assets like Solana and pulling SOL down from above $121 toward $116.
- Institutional Spot ETF Net Outflows: U.S. spot Solana ETFs recorded consecutive daily net outflows, including $3.68 million in redemptions on October 6 following previous negative sessions, signaling a temporary slowdown in institutional spot buying pressure.
- Technical Resistance Rejection at $125: Repeated failures to break through the key $124–$125 resistance ceiling have capped recent upside momentum, elevating the risk of a technical breakdown below $116 toward the 50-day moving average near $104.
- Macro Headwinds and High-Beta Sensitivity: Risk-off sentiment across broader markets driven by sustained high Treasury yields and tight monetary expectations continues to prompt capital rotation out of high-beta altcoins, exacerbating intraday volatility for SOL.
This article may include AI-generated content that is human-reviewed, which is for reference and general information purposes only and does not constitute investment advice.
Recommended Articles










Comments (0)
Click the $ button, enter the symbol, and select to link a stock, ETF, or other ticker.