


Nebius Group NV Stock (NBIS) Moved Down by 5.74% on Oct 7: Facts Behind the Movement



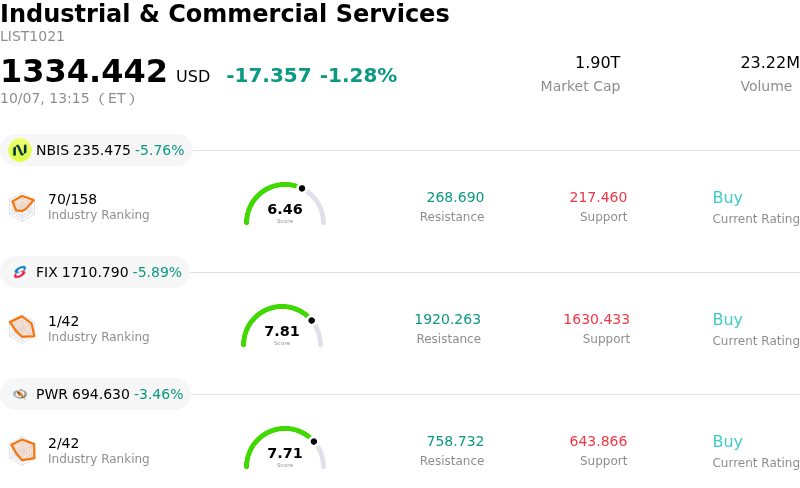
Nebius Group NV (NBIS) moved down by 5.74%. The Industrial & Commercial Services sector is down by 1.28%. The company underperformed the industry. Top 3 stocks by turnover in the sector: Nebius Group NV (NBIS) down 5.76%; Comfort Systems USA Inc (FIX) down 5.89%; Quanta Services Inc (PWR) down 3.46%.
What is driving Nebius Group NV (NBIS)’s stock price down today?
Nebius Group N.V. experienced notable downward pressure and intraday volatility primarily driven by market reaction to extensive executive insider selling disclosures. Disclosures revealed substantial share liquidations by senior executives, including a large-scale sale by the Chief Operating Officer alongside sales by other key officers. This concentrated wave of executive divestitures raised immediate concerns among market participants regarding leadership confidence, triggering profit-taking following the equity's extended rally.
Compounding the negative sentiment are persistent valuation and financial sustainability concerns. Shares of Nebius have been trading at highly elevated sales multiples relative to traditional cloud and software peers, leaving the equity especially sensitive to shifts in market sentiment. While demand for specialized artificial intelligence infrastructure remains strong, institutional analysts continue to highlight the burden of massive capital expenditures required to expand GPU clusters and secure data center power capacity. These heavy funding requirements exert near-term pressure on free cash flow profiles, amplifying investor caution during periods of broader market consolidation.
Additionally, profit-taking across high-beta artificial intelligence and neocloud infrastructure providers contributed to the turbulent trading session. As high-growth compute providers attempt to balance aggressive growth commitments against operational execution risks, price volatility has intensified. For institutional investors, the combination of executive insider sales, intense capital requirements, and a premium valuation footprint underscores the ongoing tension between long-term structural growth opportunities and short-term execution challenges.
Technical Analysis of Nebius Group NV (NBIS)
Technically, Nebius Group NV (NBIS) shows a MACD (12,26,9) value of 1.296, indicating a buy signal. The RSI at 52.240 suggests neutral condition and the Williams %R at 43.806 suggests buy condition. Please monitor closely.
Fundamental Analysis of Nebius Group NV (NBIS)
Nebius Group NV (NBIS) is in the Industrial & Commercial Services industry. Its latest annual revenue is $529.80M, ranking 113 in the industry. The net profit is $82.50M, ranking 74 in the industry. Company Profile
Over the past month, multiple analysts have rated the company as Buy, with an average price target of $291.20, a high of $410.00, and a low of $144.00.
More details about Nebius Group NV (NBIS)
Company Specific Risks:
- Executive Insider Sales Disclosures: SEC Form 4 disclosures revealed that top executives, including CEO Arkadiy Volozh, CTO Danila Shtan, and Chief Infrastructure Officer Andrey Korolenko, sold a aggregate of 81,414 Class A shares worth over $19.07 million, triggering institutional selling concerns and intraday stock volatility.
- Widening Net Losses and Heavy Capital Drag: Financial disclosures show Nebius swung to a $190.4 million net loss from continuing operations in Q2 2026 (down from a $502.5 million net profit in Q2 2025), driven by aggressive capital expenditures of $5.66 billion that outpaced operating cash flows and increased total debt to approximately $8.5 billion.
- Extreme Valuation Multiples and Compression Exposure: Financial market analyses highlight that Nebius trades at an elevated Price-to-Sales multiple of approximately 47.0x—drastically exceeding the software sector average of 3.9x—leaving the stock highly vulnerable to severe price corrections if growth decelerates.
- Operational Execution and Infrastructure Dependencies: Aggressive geographic scaling of physical AI cloud assets exposes the company to operational bottlenecks, heavy third-party power and network connectivity dependencies, and financial losses if industry demand for specialized compute capacity decelerates.
This article may include AI-generated content that is human-reviewed, which is for reference and general information purposes only and does not constitute investment advice.
Recommended Articles








Comments (0)
Click the $ button, enter the symbol, and select to link a stock, ETF, or other ticker.