


Deere & Co Stock (DE) Moved Down by 3.07% on Oct 7: What Signal Does It Send?



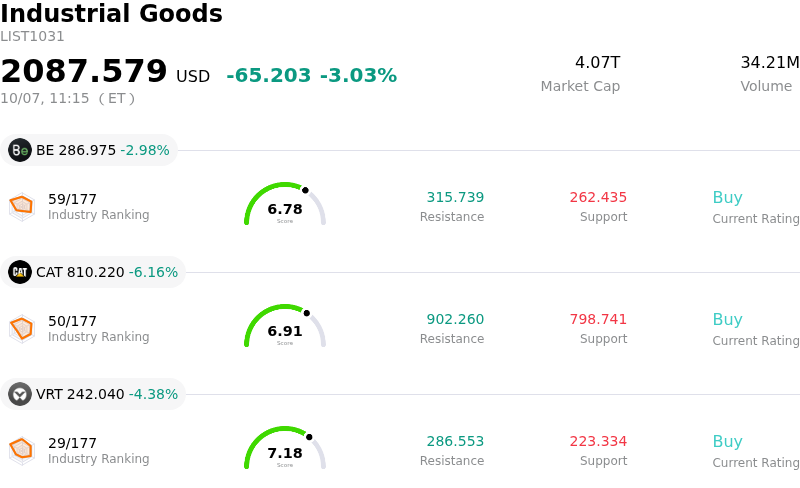
Deere & Co (DE) moved down by 3.07%. The Industrial Goods sector is down by 3.03%. The company underperformed the industry. Top 3 stocks by turnover in the sector: Bloom Energy Corp (BE) down 2.98%; Caterpillar Inc (CAT) down 6.16%; Vertiv Holdings Co (VRT) down 4.38%.
What is driving Deere & Co (DE)’s stock price down today?
Deere & Company experienced downward momentum in the stock market, reflecting a combination of macroeconomic headwinds, ongoing softness in large agricultural machinery demand, and valuation adjustments following a strong preceding rally. A key macro driver exerting pressure on the broad industrial sector is the continued elevation of Treasury yields and high benchmark interest rates. Higher borrowing costs directly impact financing-sensitive capital goods markets by inflating equipment lease and loan rates for commercial contractors and agricultural producers, leading buyers to defer fleet replacements and non-essential machinery upgrades.
At the micro level, fundamental concerns regarding core farm economics continue to weigh on market sentiment. Depressed crop realizations and elevated operating input costs have compressed farm margins, causing North American agricultural producers to pull back on orders for high-horsepower tractors and combines. Although Deere has leveraged strength in its Construction and Forestry division as well as compact equipment to mitigate top-line headwinds, high dealer inventories of used high-horsepower machinery remain a limiting factor for new unit order intake in the core agricultural segment.
Profitability expectations are further burdened by persistent tariff drag and supply chain cost pressures. Management continues to absorb substantial annualized tariff costs, which test price realization capabilities across machinery lines. While non-agricultural divisions show resilience, cost inflation narrows margin upside and leaves earnings guidance reliant on tight operational execution.
Finally, valuation dynamics contributed to the pull-back. Having traded at elevated forward earnings multiples well above broad industrial averages, the stock faced heightened vulnerability to profit-taking and position rebalancing by institutional investors. With consensus analyst price targets sitting near recent trading levels, market participants demonstrated caution, opting to de-risk ahead of upcoming quarterly reports and broader cyclical signals.
Technical Analysis of Deere & Co (DE)
Technically, Deere & Co (DE) shows a MACD (12,26,9) value of -8.742, indicating a neutral signal. The RSI at 45.586 suggests neutral condition and the Williams %R at 76.565 suggests sell condition. Please monitor closely.
Fundamental Analysis of Deere & Co (DE)
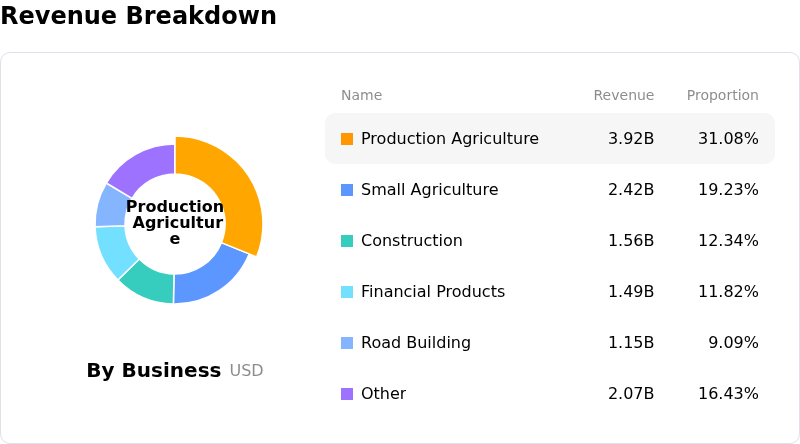
Deere & Co (DE) is in the Industrial Goods industry. Its latest annual revenue is $45.67B, ranking 2 in the industry. The net profit is $5.03B, ranking 2 in the industry. Company Profile
Over the past month, multiple analysts have rated the company as Buy, with an average price target of $683.85, a high of $813.00, and a low of $471.00.
More details about Deere & Co (DE)
Company Specific Risks:
- Persistent Demand Softness in Core Agriculture: Weakness in the key Production & Precision Agriculture division continues to depress overall equipment revenue, as low crop prices and high operating input costs force commercial growers across North America and South America to postpone large machinery purchases.
- High Used Equipment Dealer Inventories: Elevated stocks of used high-horsepower machinery across retail dealer channels are forcing management to limit new unit shipments to avoid over-saturating the market, directly constraining near-term order volumes.
- Compounding Tariff and Manufacturing Cost Drag: Cumulative net tariff burdens pose a substantial threat to operating profitability, with net tariff expenses projected to reach $750 million in fiscal 2026 and approach $1 billion by 2027, compressing segment profit margins.
- Valuation Compression Vulnerability: Operating at a forward earnings multiple significantly above the broader industrial sector average, the stock faces heightened exposure to intraday sell-offs and analyst downgrades if the expected agricultural cycle bottom experiences further delays.
This article may include AI-generated content that is human-reviewed, which is for reference and general information purposes only and does not constitute investment advice.
Recommended Articles








Comments (0)
Click the $ button, enter the symbol, and select to link a stock, ETF, or other ticker.