


Palo Alto Networks Inc Stock (PANW) Moved Down by 3.00% on Oct 7: What Investors Need To Know



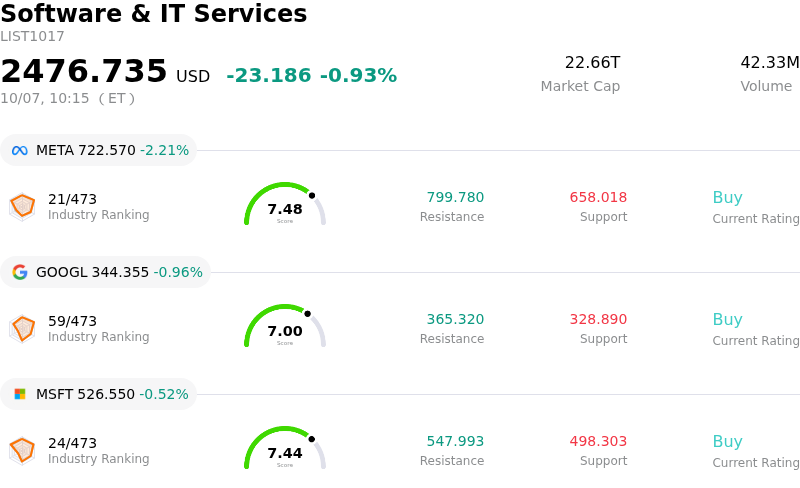
Palo Alto Networks Inc (PANW) moved down by 3.00%. The Software & IT Services sector is down by 0.93%. The company underperformed the industry. Top 3 stocks by turnover in the sector: Meta Platforms Inc (META) down 2.21%; Alphabet Inc Class A (GOOGL) down 0.98%; Microsoft Corp (MSFT) down 0.52%.
What is driving Palo Alto Networks Inc (PANW)’s stock price down today?
Palo Alto Networks experienced a downward pull, primarily driven by profit-taking following a powerful multi-session rally that pushed the stock to new record highs. After absorbing positive spillover from sector peer updates and strong momentum around artificial intelligence security announcements, short-term traders and institutional investors moved to lock in gains. The retracement reflects routine consolidation after a sharp multi-week advance rather than a breakdown in fundamental operations.
Valuation friction has emerged as a key headwind following the recent market surge. With the company trading at a premium multiple relative to consensus fair-value benchmarks and broader enterprise software peers, the equity faces heightened sensitivity to short-term market fluctuations. Although customer adoption of the company's security platformization strategy remains robust, market participants are increasingly scrutinizing whether current trading levels fully price in medium-term growth expectations. Investors are also monitoring potential margin pressure tied to cloud infrastructure expenditures and specialist labor required to power newly launched generative AI defense tools.
Longer-term sentiment remains anchored by a debate over forward growth trajectory and deal integration. While next-generation security annual recurring revenue continues to expand, forward management guidance pointing toward a natural deceleration relative to historical surge rates has induced caution among valuation-sensitive buyers. Additionally, operational focus remains on seamlessly integrating recent software acquisitions without incurring margin compression. Consequently, the share decline represents a reassessment of valuation premiums as investors balance strong enterprise cybersecurity demand against elevated market expectations.
Technical Analysis of Palo Alto Networks Inc (PANW)
Technically, Palo Alto Networks Inc (PANW) shows a MACD (12,26,9) value of 5.907, indicating a buy signal. The RSI at 61.250 suggests neutral condition and the Williams %R at 31.844 suggests buy condition. Please monitor closely.
Media Coverage of Palo Alto Networks Inc (PANW)
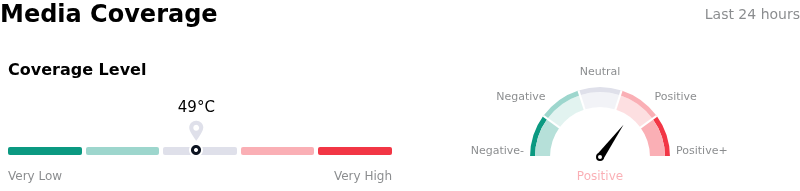
In terms of media coverage, Palo Alto Networks Inc (PANW) shows a coverage score of 49, indicating a moderate level of media attention. The overall market sentiment index is currently in bullish zone.
Fundamental Analysis of Palo Alto Networks Inc (PANW)
Palo Alto Networks Inc (PANW) is in the Software & IT Services industry. Its latest annual revenue is $11.48B, ranking 33 in the industry. The net profit is $307.00M, ranking 90 in the industry. Company Profile
Over the past month, multiple analysts have rated the company as Buy, with an average price target of $396.98, a high of $475.00, and a low of $190.00.
More details about Palo Alto Networks Inc (PANW)
Company Specific Risks:
- Extreme Valuation Premium and Sensitivity: Trading near record highs above $420 per share and significantly above consensus fair value targets, PANW's elevated valuation leaves the stock exceptionally vulnerable to intraday pullbacks and profit-taking on minor market swings.
- Gross Margin Compression: A structural business shift as cloud and SaaS revenue outpaces legacy hardware—combined with elevated memory and storage input costs—continues to squeeze adjusted gross margins down to 74.8%.
- Decelerating Forward Top-Line Trajectory: Forward projections for fiscal 2027 point toward revenue growth moderating to the 20%–24% range, driving institutional analyst skepticism that historical growth rates are normalizing.
- M&A Integration and AI Security Monetization Risks: Rapid acquisition-led platform expansion, including the integration of Chronosphere and Console, risks margin dilution and operational drag while the economics and profitability of new AI offerings like Unit 42 Frontier AI Defense remain unproven.
This article may include AI-generated content that is human-reviewed, which is for reference and general information purposes only and does not constitute investment advice.
Recommended Articles








Comments (0)
Click the $ button, enter the symbol, and select to link a stock, ETF, or other ticker.