


Ge Vernova Inc Stock (GEV) Opened Down by 3.48% on Oct 7: Drivers Behind the Movement



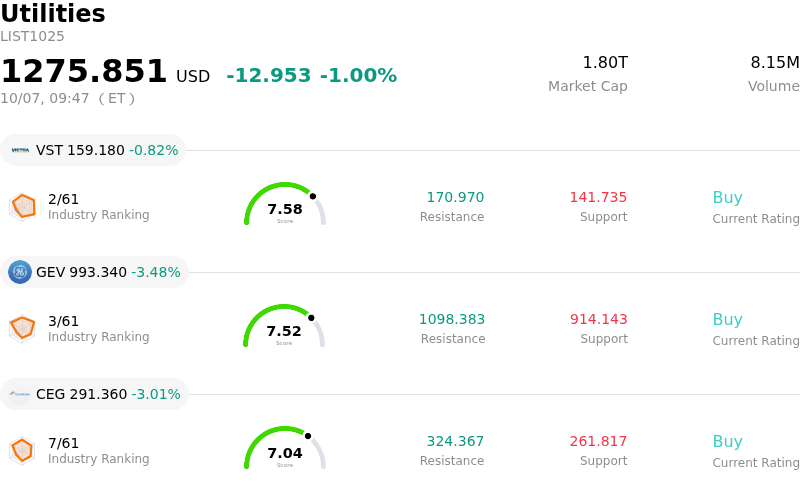
Ge Vernova Inc (GEV) opened down by 3.48%. The Utilities sector is down by 1.00%. The company underperformed the industry. Top 3 stocks by turnover in the sector: Vistra Corp (VST) down 0.82%; Ge Vernova Inc (GEV) down 3.48%; Constellation Energy Corp (CEG) down 3.01%.
What is driving Ge Vernova Inc (GEV)’s stock price down today?
GE Vernova experienced downward pressure during the trading session, undergoing noticeable intraday volatility following a recent multi-day rally. The price retreat primarily reflects profit-taking by market participants after strong recent gains, combined with heightened valuation sensitivity across high-flying power infrastructure and capital equipment equities. As a primary beneficiary of artificial intelligence data center power requirements and global grid modernization, the company trades at premium valuation multiples that leave the stock vulnerable to short-term pullbacks when broader sector momentum pauses.
From a fundamental perspective, institutional focus is increasingly directed toward the company's cash flow cadence and segment profitability. Management's full-year outlook emphasizes a heavily front-loaded free cash flow profile, largely fueled by sizable upfront customer down payments for gas turbines and electrification equipment in the early months of the year. Expectations of a relative deceleration in cash generation during the second half of the year, alongside persistent EBITDA losses within the Wind segment, have led some investors to derisk positions ahead of the upcoming quarterly earnings announcement.
Notwithstanding short-term trading pressures, the underlying operational foundation remains anchored by a massive order backlog in high-margin gas power generation, grid equipment demand, and expanding clean energy initiatives. However, near-term headwinds—including localized regulatory friction regarding large data center power connections, supply chain bottlenecks, and institutional portfolio rebalancing—have contributed to negative price action. Investors are closely monitoring how efficiently the company can convert slot reservations into margin-accretive revenue while managing wind division cost pressures.
Technical Analysis of Ge Vernova Inc (GEV)
Technically, Ge Vernova Inc (GEV) shows a MACD (12,26,9) value of 17.543, indicating a buy signal. The RSI at 54.963 suggests neutral condition and the Williams %R at 48.526 suggests neutral condition. Please monitor closely.
Media Coverage of Ge Vernova Inc (GEV)
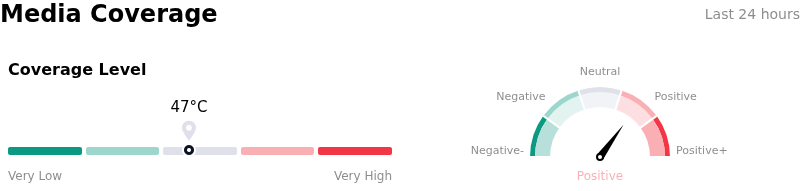
In terms of media coverage, Ge Vernova Inc (GEV) shows a coverage score of 47, indicating a moderate level of media attention. The overall market sentiment index is currently in bullish zone.
Fundamental Analysis of Ge Vernova Inc (GEV)
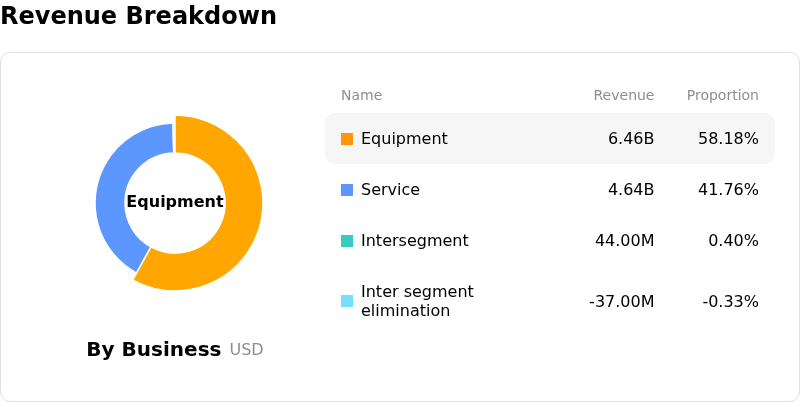
Ge Vernova Inc (GEV) is in the Utilities industry. Its latest annual revenue is $38.07B, ranking 2 in the industry. The net profit is $4.88B, ranking 4 in the industry. Company Profile
Over the past month, multiple analysts have rated the company as Buy, with an average price target of $1182.18, a high of $1450.00, and a low of $470.00.
More details about Ge Vernova Inc (GEV)
Company Specific Risks:
- Persistent Wind Segment Drag: GE Vernova's Wind division continues to operate at a loss, recording substantial segment EBITDA losses and a projected full-year deficit of roughly $400 million, exposing consolidated profitability to ongoing offshore project execution risks and onshore demand shifts.
- Earnings Execution Volatility and Margin Compression: Despite top-line revenue expansion, recent quarterly earnings missed Wall Street consensus estimates by over 18% ($2.47 reported versus $3.17 expected), highlighting operational execution vulnerabilities and thin operating margins near 5.3%.
- Peak-Cycle Valuation and AI Order Vulnerability: Sell-side analysts have flagged overbought technical indicators and peak-cycle gas turbine demand risks, warning that the stock's elevated valuation multiple leaves it vulnerable to order slowdowns or cancellations from AI data center operators and electric utilities.
- Supply Chain and Trade Policy Constraints: Production capacity bottlenecks across grid equipment and heavy-duty gas turbine manufacturing, combined with exposure to foreign trade tariffs and European regulatory shifts, threaten the clean conversion of backlog into recognized revenue.
This article may include AI-generated content that is human-reviewed, which is for reference and general information purposes only and does not constitute investment advice.
Recommended Articles








Comments (0)
Click the $ button, enter the symbol, and select to link a stock, ETF, or other ticker.