


BNB (BNBUSD) Is down 1.98% on Oct 7: What Do On-Chain Data and Market Sentiment Show?



BNB (BNBUSD) is down 1.98% at Oct 7 22:10(ET), now at $762.3, with a 7-day down of 0.43%.
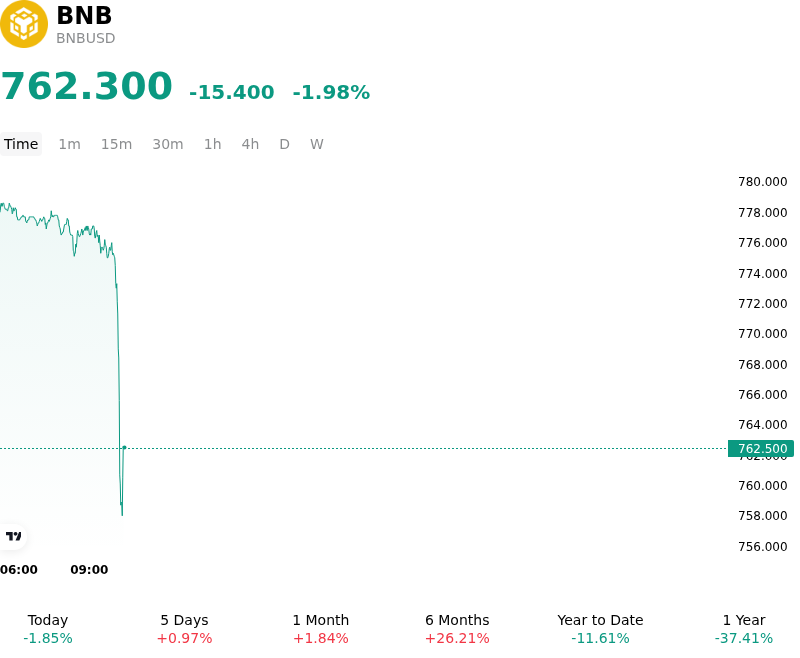
What is driving BNB (BNBUSD)’s stock price down today?
BNB experienced downside pressure as market participants engaged in profit-taking following a failed technical breakout above a critical psychological and structural resistance level around the $800 mark. After briefly testing multi-month highs above this barrier, spot demand faltered, triggering defensive liquidity positioning and automated sell orders as traders de-risked. The rejection reinforced overhead supply concentration, prompting tactical capital to rotate into defensive postures while waiting for clearer structural support to form.
Derivatives market positioning amplified the retracement, as elevated leverage built up during the approach to major resistance underwent rapid unwinding. Long position liquidations across major derivatives venues added localized sell pressure, suppressing intraday bid depth. Concurrently, broader macroeconomic headwinds, including persistent Treasury yields and cautious global risk-asset sentiment, elevated the opportunity cost of holding non-yielding digital assets, keeping institutional capital allocation selective and dampening momentum across major Layer-1 tokens.
From an ecosystem perspective, BNB Chain continues to maintain underlying fundamental tailwinds, supported by expanding activity in tokenized assets and network performance enhancements following recent infrastructure upgrades. Anticipation surrounding the routine quarterly auto-burn mechanism also continues to provide baseline supply contraction expectations. However, because scheduled programmatic supply reductions are widely anticipated and priced in advance by institutional trading desks, they provided limited immediate offset to short-term liquidity contraction and technical profit-taking. Market participants continue to monitor whether spot demand can defend lower structural support zones, weighing Federal Reserve interest rate expectations against broader digital asset capital flows to gauge the sustainability of BNB's medium-term trend.
Technical Analysis of BNB (BNBUSD)
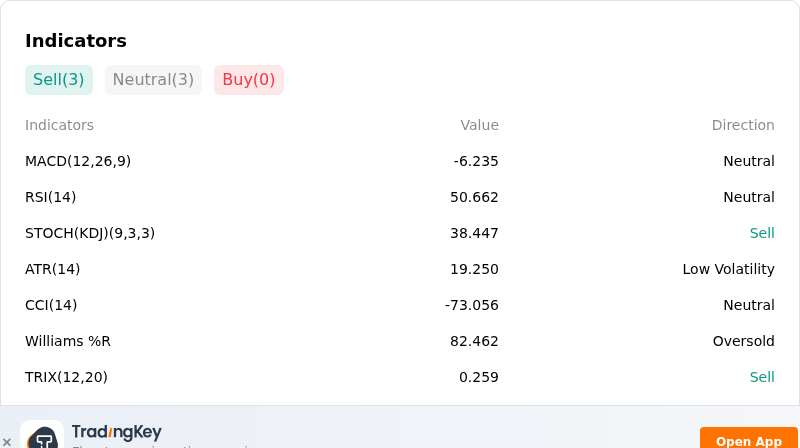
Technically, BNB (BNBUSD) shows a MACD (12,26,9) value of -6.235, indicating a neutral signal. The RSI at 50.662 suggests neutral condition and the Williams %R at 82.462 suggests oversold condition. Please monitor closely.
More details about BNB (BNBUSD)
Recent Events and Risks:
- EU MiCA Regulatory Enforcement Scrutiny: European regulators and ESMA have increased inquiries into Binance's reliance on "reverse solicitation" exemptions following its rejected MiCA license application, creating heightened operational risk and potential legal enforcement actions.
- Elevated Open Interest and Liquidation Clusters: High derivatives open interest leaves BNB market structure vulnerable to sudden leverage unwinds, where clustered long liquidations can trigger sharp intraday sell-offs if local support breaks.
- Overhead Resistance and Momentum Exhaustion: Heavy sell-side liquidity near key resistance levels around $800 has repeatedly rejected upside attempts, leaving momentum indicators turning bearish and threatening pullbacks toward lower moving averages.
- Whale Inflow Spikes and Reduced DEX Volume: Bursts of large whale deposits onto centralized exchanges alongside cooling trading volumes on the BNB Smart Chain limit organic buy-side market depth during intraday pullbacks.
This article may include AI-generated content that is human-reviewed, which is for reference and general information purposes only and does not constitute investment advice.
Recommended Articles









Comments (0)
Click the $ button, enter the symbol, and select to link a stock, ETF, or other ticker.