


Solana (SOLUSD) Is down 1.11% on Oct 7: Why It Happened



Solana (SOLUSD) is down 1.11% at Oct 7 21:55(ET), now at $118.67, with a 7-day up of 1.38%.
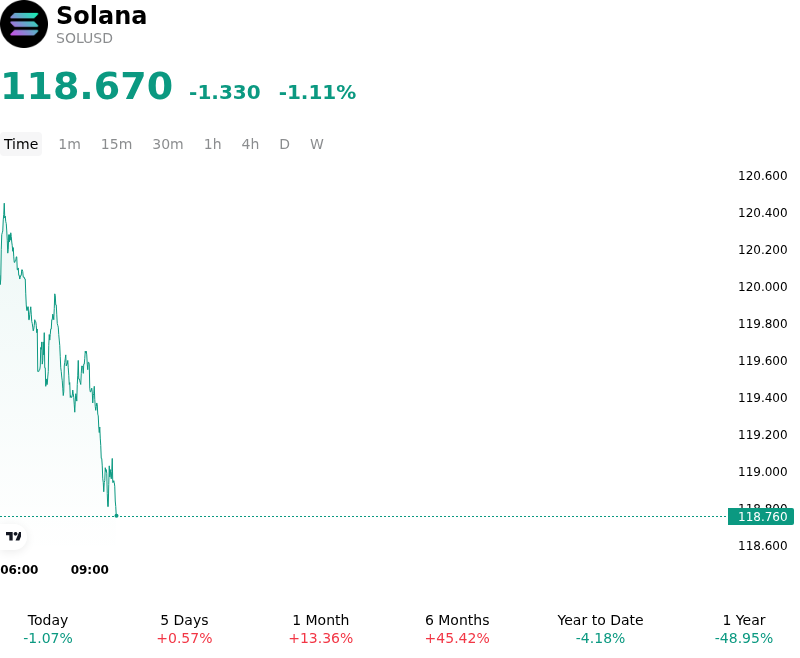
What is driving Solana (SOLUSD)’s stock price down today?
Digital asset markets experienced brief consolidation as institutional participants adjusted risk exposure ahead of key macroeconomic catalysts, including the release of Federal Reserve policy minutes. The broader cautious stance across global risk assets prompted light profit-taking in high-beta Layer-1 protocols like Solana following a strong multi-week advance. Firm U.S. dollar pricing and steady Treasury yields maintained temporary upward pressure on discount rates, dampening immediate risk appetite across major altcoins.
From an asset-specific perspective, market sentiment digested recent ecosystem developments, including the Solana Foundation's release of an open-source delivery-versus-payment settlement framework designed for institutional transaction workflows. While the initiative underscores Solana's expanding presence in enterprise financial architecture, market participants recognized that institutional settlement frameworks predominantly utilize fiat-backed stablecoins for value settlement, keeping direct native token value capture limited to minimal execution fees. This perspective prompted short-term repricing as speculative traders recalibrated immediate demand expectations.
In derivatives and on-chain venues, modest leverage reduction contributed to the minor downside pull. Futures open interest contracted as market participants trimmed long exposure near established upper technical resistance levels, preventing an immediate upside continuation. Despite the localized pullback, ongoing institutional fund engagement and sustained decentralized trading volumes continue to underpin Solana's mid-term structural outlook, indicating that current price action reflects standard market digestion within a broader consolidation range rather than a fundamental trend reversal.
Technical Analysis of Solana (SOLUSD)
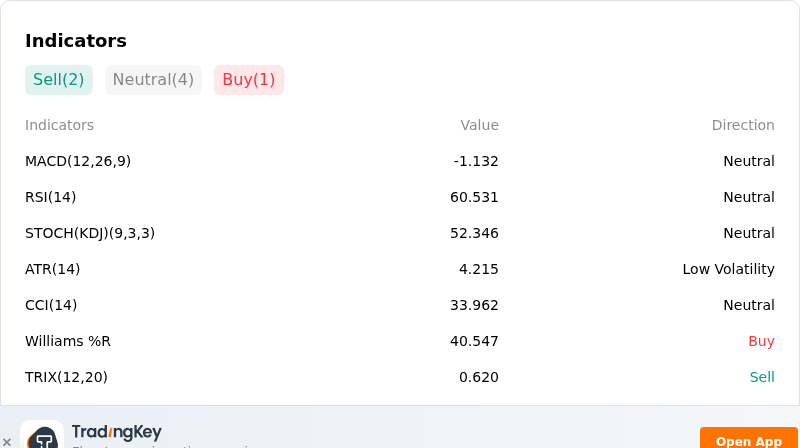
Technically, Solana (SOLUSD) shows a MACD (12,26,9) value of -1.119, indicating a neutral signal. The RSI at 60.742 suggests neutral condition and the Williams %R at 39.743 suggests buy condition. Please monitor closely.
More details about Solana (SOLUSD)
Recent Events and Risks:
- Spot ETF Outflows and Institutional Slowdown: Recent fund flow disclosures indicate a reversal in U.S. spot Solana ETF allocations with $9.2 million in daily net outflows—driven by redemptions in Bitwise's BSOL and FSOL—eroding the institutional spot demand previously absorbing secondary market sell pressure.
- Over-Leveraged Long Position Liquidation Cascades: Perpetual futures positioning remains heavily skewed long near the critical $115 to $116 support threshold, leaving market structure highly vulnerable to forced liquidation cascades and downside acceleration toward $112 and $107 if technical support breaks.
- Mainnet Upgrade Activation Uncertainty: Short-term momentum has cooled after core developers confirmed the Alpenglow consensus upgrade remains limited to testnet without a firm mainnet launch date, prompting profit-taking and repeated technical rejections at the $124 to $125 resistance ceiling.
- Ecosystem Liquidity Drain and Macro Pressure: Broad risk-off sentiment driven by firm U.S. Treasury yields and a sharp retracement across Solana-native ecosystem tokens have combined to drain speculative liquidity from the network, accelerating short-term capital rotation away from high-beta layer-1 assets.
This article may include AI-generated content that is human-reviewed, which is for reference and general information purposes only and does not constitute investment advice.
Recommended Articles









Comments (0)
Click the $ button, enter the symbol, and select to link a stock, ETF, or other ticker.