


Lam Research Corp Stock (LRCX) Moved Down by 3.87% on Oct 6: Drivers Behind the Movement



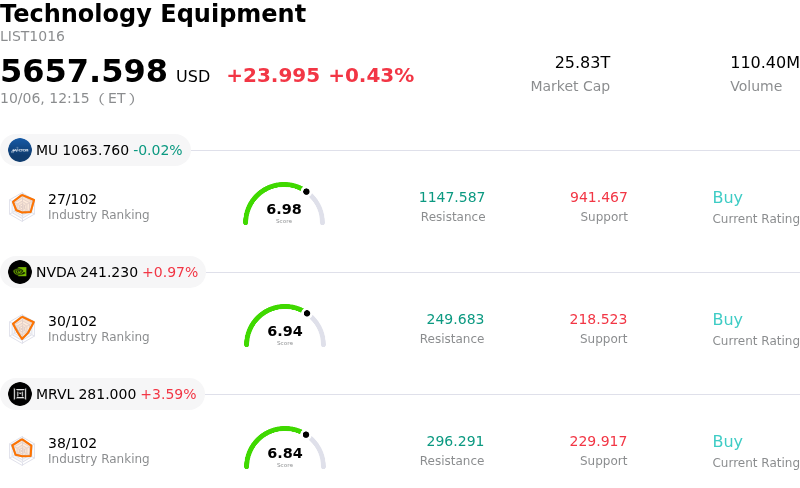
Lam Research Corp (LRCX) moved down by 3.87%. The Technology Equipment sector is up by 0.43%. The company underperformed the industry. Top 3 stocks by turnover in the sector: Micron Technology Inc (MU) up 0.15%; NVIDIA Corp (NVDA) up 1.04%; Marvell Technology Inc (MRVL) up 3.62%.
What is driving Lam Research Corp (LRCX)’s stock price down today?
Lam Research experienced intraday volatility and downward pressure as market participants locked in gains following an extended rally in the semiconductor equipment sector. The stock had outperformed broader market indexes over the preceding weeks, driven by enthusiasm surrounding artificial intelligence infrastructure and sustained capital expenditure in advanced wafer fabrication tools. After such a swift run-up, short-term profit-taking emerged as investors reassessed risk exposure ahead of upcoming industry catalysts.
The pullback unfolded despite positive sell-side sentiment, including analyst price target revisions that highlighted Lam Research's market share gains in advanced logic nodes and memory equipment. Wall Street analysts have emphasized strong demand visibility linked to cleanroom capacity and next-generation chip manufacturing. However, with the company scheduled to report its quarterly financial results later in the month and valuation multiples elevated relative to historical levels, market participants opted to reduce position sizes to manage downside risk.
Broader sector dynamics and macroeconomic sentiment also contributed to the pressure. Higher Treasury yields and routine portfolio rebalancing across high-growth technology equities weighed on semiconductor toolmakers. While the long-term fundamentals for wafer fabrication equipment remain intact due to structural demand in high-performance computing and custom silicon, near-term share price performance continues to reflect heightened market sensitivity to valuation, macro conditions, and pre-earnings repositioning.
Technical Analysis of Lam Research Corp (LRCX)
Technically, Lam Research Corp (LRCX) shows a MACD (12,26,9) value of 10.273, indicating a buy signal. The RSI at 58.445 suggests neutral condition and the Williams %R at 23.713 suggests buy condition. Please monitor closely.
Fundamental Analysis of Lam Research Corp (LRCX)
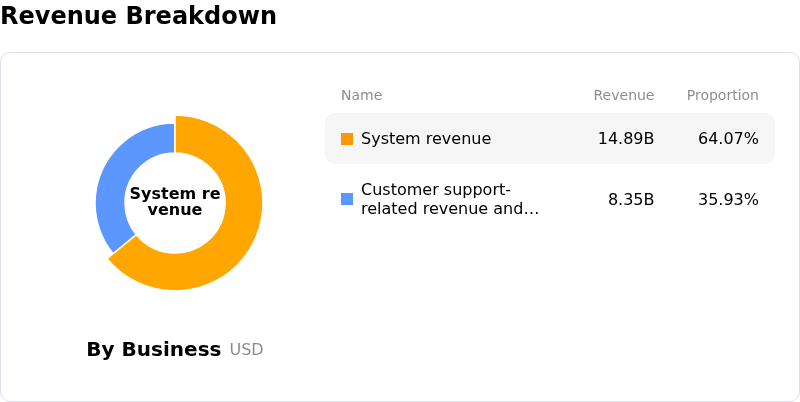
Lam Research Corp (LRCX) is in the Technology Equipment industry. Its latest annual revenue is $23.23B, ranking 12 in the industry. The net profit is $7.27B, ranking 7 in the industry. Company Profile
Over the past month, multiple analysts have rated the company as Buy, with an average price target of $371.65, a high of $500.00, and a low of $213.00.
More details about Lam Research Corp (LRCX)
Company Specific Risks:
- Valuation Compression & High Earnings Expectations: Lam Research trades at a trailing P/E ratio of nearly 59x—well above its historical 5-year median of 23.8x—leaving the stock vulnerable to sharp intraday pullbacks ahead of its October 21 earnings report if guidance fails to justify elevated Wall Street targets.
- Substantial Insider Share Liquidation: Market filings reveal $175.9 million in insider stock sales over the past 12 months with zero insider purchases, signaling a lack of insider buying confidence while the equity trades near high valuation multiples.
- Regulatory Risks & Uneven End-Market Demand: The company faces persistent headwinds from U.S. export controls on advanced semiconductor equipment to China, alongside demand bifurcation where weakness in non-AI consumer and industrial chip markets threatens overall wafer fabrication equipment spending.
- Accrual Expansion & Cash Flow Discrepancies: Financial quality models highlight an increasing reliance on non-cash accruals and rapid balance sheet expansion relative to cash generation, exposing the firm to working capital risks if customer equipment installation timelines slip.
This article may include AI-generated content that is human-reviewed, which is for reference and general information purposes only and does not constitute investment advice.
Recommended Articles








Comments (0)
Click the $ button, enter the symbol, and select to link a stock, ETF, or other ticker.