


KLA Corp Stock (KLAC) Moved Down by 4.08% on Oct 6: What Signal Does It Send?



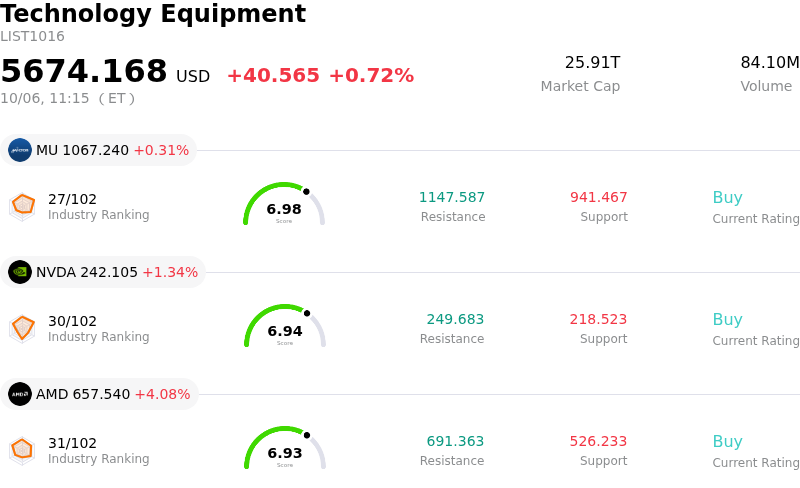
KLA Corp (KLAC) moved down by 4.08%. The Technology Equipment sector is up by 0.72%. The company underperformed the industry. Top 3 stocks by turnover in the sector: Micron Technology Inc (MU) up 0.31%; NVIDIA Corp (NVDA) up 1.34%; Advanced Micro Devices Inc (AMD) up 4.05%.
What is driving KLA Corp (KLAC)’s stock price down today?
KLA Corporation experienced downward momentum and heightened intraday trading volatility following a wave of analyst target price reductions that triggered valuation-driven selling across the semiconductor equipment sector. A key driver of the decline was a major Wall Street firm lowering its price target on the company, explicitly citing multiple compression and an elevated valuation relative to historical medians. Although underlying revenue and earnings projections for future fiscal periods were raised, analysts reduced target valuation multiples to reflect a broader valuation reset across capital equipment peers. Similar target price adjustments from other institutional research desks reinforced cautious sentiment, prompting investors to take profits after a period of strong relative performance.
The pullback also reflects ongoing operational and industry dynamics within the wafer fabrication equipment landscape. Despite long-term tailwinds from artificial intelligence infrastructure buildouts and advanced packaging adoption, market participants are weighing near-term gross margin constraints and input cost pressures. KLA continues to navigate regulatory uncertainties related to U.S. export controls and restrictions on sales of advanced equipment into the Chinese market, which represents a notable portion of sector revenues. With valuation multiples remaining elevated against historical averages, the stock faces heightened sensitivity to potential order delays, supply chain frictions, or shifts in customer capital expenditure timelines.
Institutional sentiment remains divided between robust long-term growth prospects and elevated short-term valuation risks. While process control technology leadership and expanding advanced packaging demand provide a strong fundamental foundation, short-term portfolio rebalancing and risk-averse positioning have exacerbated price fluctuations. Market focus is now shifting toward upcoming quarterly earnings disclosures and management guidance to assess whether revenue growth and margin execution can support premium valuation metrics amid persistent macroeconomic and trade uncertainties.
Technical Analysis of KLA Corp (KLAC)
Technically, KLA Corp (KLAC) shows a MACD (12,26,9) value of 5.860, indicating a buy signal. The RSI at 58.006 suggests neutral condition and the Williams %R at 23.805 suggests buy condition. Please monitor closely.
Fundamental Analysis of KLA Corp (KLAC)
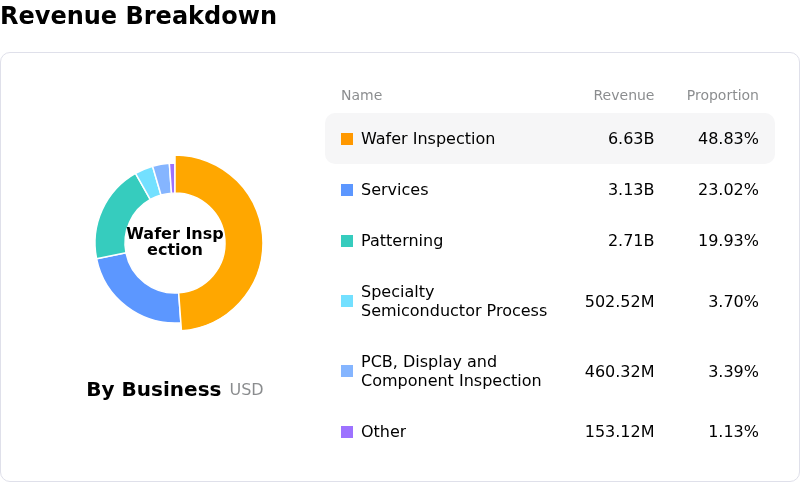
KLA Corp (KLAC) is in the Technology Equipment industry. Its latest annual revenue is $13.58B, ranking 15 in the industry. The net profit is $4.83B, ranking 11 in the industry. Company Profile
Over the past month, multiple analysts have rated the company as Buy, with an average price target of $229.23, a high of $325.00, and a low of $138.80.
More details about KLA Corp (KLAC)
Company Specific Risks:
- Elevated Valuation Multiple and Analyst Downgrades: Following sell-side rating downgrades to Hold and price target reductions by research firms including Zacks and UBS, KLAC trades at a rich forward P/E multiple well above historical averages, leaving the stock highly vulnerable to sharp pullbacks and institutional profit-taking during sector-wide technology pullbacks.
- China Export Control Restrictions and Regional Competition: Tightening U.S. export controls and trade tariffs continue to jeopardize an estimated $300 million to $350 million in revenue from Chinese wafer fab equipment customers, compounded by emerging domestic Chinese DUV lithography alternatives threatening long-term addressable market share in the region.
- Stalled Gross Margin Expansion and Component Cost Pressures: Management's gross margin guidance remaining flat at approximately 61.5% highlights stalled margin expansion, as rising memory component input costs and supply chain friction cap operating leverage despite steady top-line revenue growth.
- Substantial Executive Equity Divestments: Recent insider tracking disclosures reveal over $110 million in executive equity sales without corresponding insider purchases, creating overhang concerns among institutional investors regarding peak-cycle valuation levels.
This article may include AI-generated content that is human-reviewed, which is for reference and general information purposes only and does not constitute investment advice.
Recommended Articles








Comments (0)
Click the $ button, enter the symbol, and select to link a stock, ETF, or other ticker.