


Interactive Brokers Group Inc Stock (IBKR) Moved Up by 3.37% on Oct 2: What Signal Does It Send?



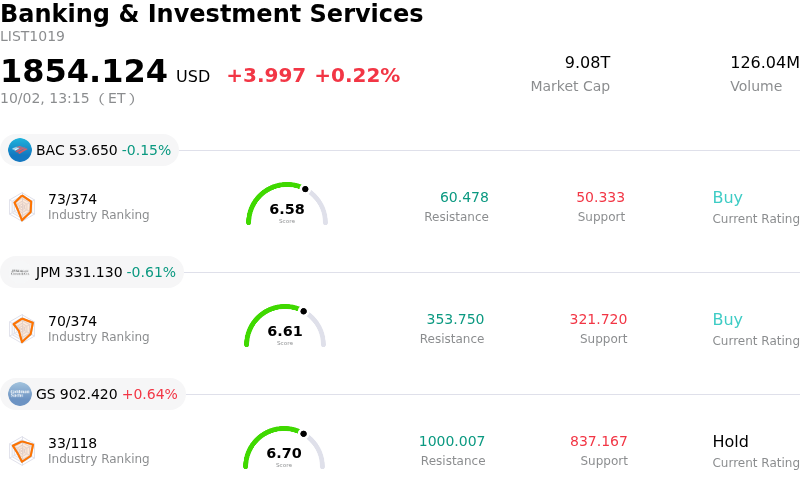
Interactive Brokers Group Inc (IBKR) moved up by 3.37%. The Banking & Investment Services sector is up by 0.22%. The company outperformed the industry. Top 3 stocks by turnover in the sector: Bank of America Corp (BAC) down 0.15%; JPMorgan Chase & Co (JPM) down 0.61%; Goldman Sachs Group Inc (GS) up 0.64%.
What is driving Interactive Brokers Group Inc (IBKR)’s stock price up today?
Interactive Brokers Group recorded notable gains as positive sentiment surrounding its core operating metrics and favorable institutional analyst coverage boosted investor buying interest. The primary catalyst driving market sentiment was the company's monthly electronic brokerage report for September, which demonstrated sustained momentum across key growth indicators. Year-over-year operational strength was highlighted by significant expansion in total client accounts, robust increases in client equity, and double-digit growth in client margin loan balances. These figures reassured investors that active market participation and leverage usage among retail and institutional traders remain firm heading into the final quarter.
Wall Street research notes further reinforced positive market dynamics. Top-tier brokerages maintained optimistic ratings, pointing to Interactive Brokers' efficient cost structure, technology-driven platform, and high-margin electronic execution model as major competitive moats. New analyst initiations with constructive outlooks and reaffirmed buy ratings provided additional tailwinds, offsetting minor price target calibrations across the sector. Investors continue to view the firm's lean operating model and global account acquisition strategy as strong drivers for revenue growth ahead of the upcoming earnings disclosure.
From a broader industry perspective, Interactive Brokers remains uniquely positioned to capitalize on automated multi-asset trading and client balance sheet growth. Even amidst shifting macroeconomic conditions and potential fluctuations in benchmark interest rates, the firm's rapidly expanding client account base and margin lending volume provide a resilient earnings foundation. The combination of steady account inflows, expanding execution capabilities across global exchanges, and solid institutional backing created a constructive backdrop for the stock's upward movement.
Technical Analysis of Interactive Brokers Group Inc (IBKR)
Technically, Interactive Brokers Group Inc (IBKR) shows a MACD (12,26,9) value of -0.683, indicating a sell signal. The RSI at 47.356 suggests neutral condition and the Williams %R at 51.621 suggests neutral condition. Please monitor closely.
Media Coverage of Interactive Brokers Group Inc (IBKR)
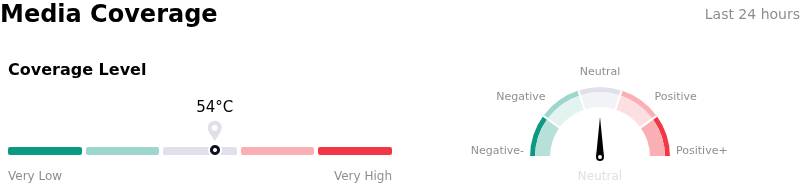
In terms of media coverage, Interactive Brokers Group Inc (IBKR) shows a coverage score of 54, indicating a moderate level of media attention. The overall market sentiment index is currently in neutral zone.
Fundamental Analysis of Interactive Brokers Group Inc (IBKR)
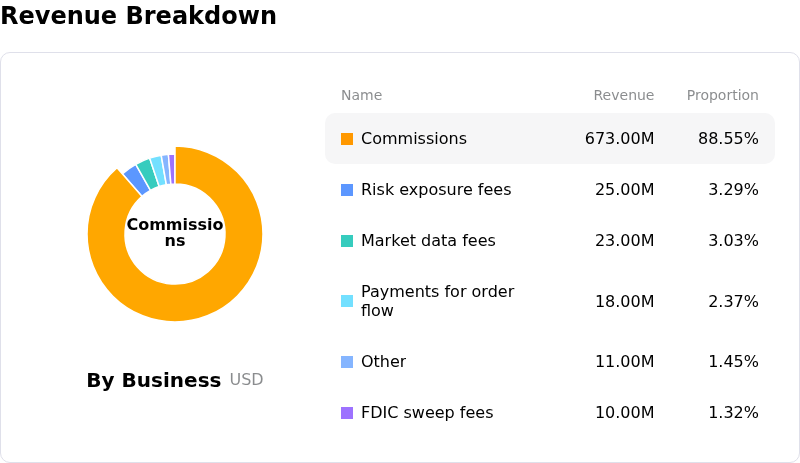
Interactive Brokers Group Inc (IBKR) is in the Banking & Investment Services industry. Its latest annual revenue is $10.00B, ranking 24 in the industry. The net profit is $984.00M, ranking 24 in the industry. Company Profile
Over the past month, multiple analysts have rated the company as Buy, with an average price target of $105.98, a high of $121.00, and a low of $72.18.
More details about Interactive Brokers Group Inc (IBKR)
Company Specific Risks:
- Sequential Contraction in Trading Engagement: Interactive Brokers reported 4.111 million Daily Average Revenue Trades (DARTs) in its September 2026 performance metrics, marking a 4% month-over-month decline from August 2026 and signaling momentum friction in active client execution activity.
- Analyst Price Target Trimming and Valuation Pressure: Institutional research desks, including Goldman Sachs, lowered price targets on IBKR amidst broader rating downgrades, reflecting concerns that the stock's elevated trailing price-to-earnings multiple (~34x) leaves little room for operational missteps.
- Fixed-Income and Currency Portfolio Drag: The company disclosed a mark-to-market loss of $307,000 on its U.S. government securities portfolio for the third quarter ended September 30, alongside a 0.45% monthly decline in its proprietary GLOBAL currency basket, highlighting exposure to interest rate volatility and foreign exchange shifts.
- Persistent Net Insider Selling: Corporate trading logs reveal $35.8 million in insider stock sales against zero open-market insider purchases over the trailing 12-month period, adding sell-side caution regarding executive alignment at current equity valuations.
This article may include AI-generated content that is human-reviewed, which is for reference and general information purposes only and does not constitute investment advice.
Recommended Articles









Comments (0)
Click the $ button, enter the symbol, and select to link a stock, ETF, or other ticker.