


Freeport-McMoRan Inc Stock (FCX) Moved Up by 3.80% on Oct 2: What Investors Need To Know



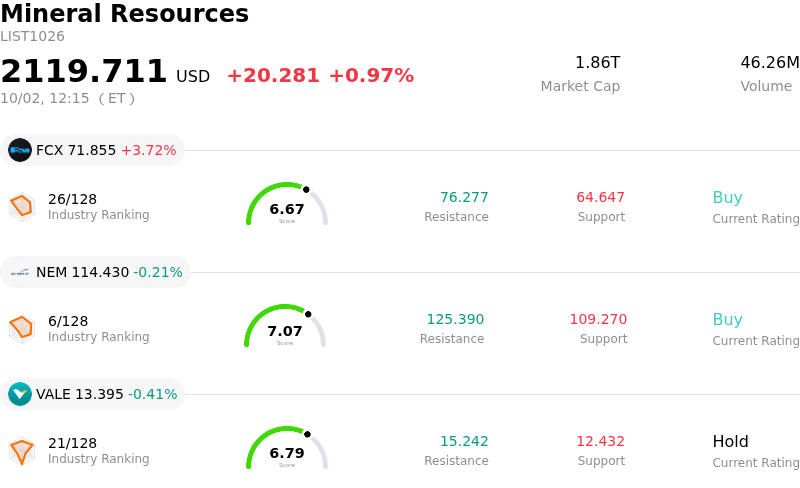
Freeport-McMoRan Inc (FCX) moved up by 3.80%. The Mineral Resources sector is up by 0.97%. The company outperformed the industry. Top 3 stocks by turnover in the sector: Freeport-McMoRan Inc (FCX) up 3.72%; Newmont Corporation (NEM) down 0.21%; Vale SA (VALE) down 0.41%.
What is driving Freeport-McMoRan Inc (FCX)’s stock price up today?
Freeport-McMoRan experienced significant upward momentum following the release of its third-quarter operational update, which reassured investors regarding production stability and operational recovery. Consolidated third-quarter copper and gold production met management targets, anchored by solid international performance that offset minor weather-related disruptions across U.S. operations. Market confidence was further boosted as the company confirmed steady progress at its flagship Grasberg underground facility in Indonesia, where mill throughput continued its recovery, and noted the successful late-August restart of its Eastern Java smelter.
A strong realized copper price environment provided an additional tailwind for the mining giant. Freeport estimated its third-quarter average realized copper price to comfortably exceed baseline expectations, reflecting tight global inventory conditions and persistent structural demand for refined metals. Although timing deferrals of refined gold sales into the fourth quarter temporarily reduced third-quarter gold volumes and elevated unit cash costs slightly, investors viewed this shift as a transient operational delay rather than a structural impairment, focusing instead on robust underlying cash flow generation.
Broader macroeconomic shifts and disciplined capital allocation strategies reinforced positive market sentiment. A softening U.S. dollar, spurred by cooler domestic labor market data, supported raw materials pricing and energized broader commodity-linked equities. Concurrently, Freeport reaffirmed its commitment to shareholder returns through its performance-based dividend framework, while advancing long-term organic expansion projects in Arizona and Chile. The combination of meeting key operational milestones, strong realized metal prices, and a supportive macro backdrop drove notable intraday buying interest.
Technical Analysis of Freeport-McMoRan Inc (FCX)
Technically, Freeport-McMoRan Inc (FCX) shows a MACD (12,26,9) value of -0.623, indicating a neutral signal. The RSI at 51.146 suggests neutral condition and the Williams %R at 43.028 suggests buy condition. Please monitor closely.
Fundamental Analysis of Freeport-McMoRan Inc (FCX)
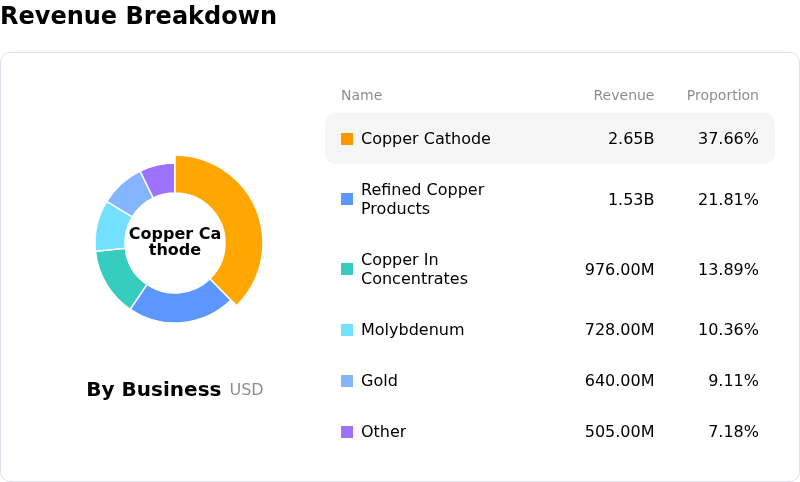
Freeport-McMoRan Inc (FCX) is in the Mineral Resources industry. Its latest annual revenue is $25.91B, ranking 7 in the industry. The net profit is $2.20B, ranking 12 in the industry. Company Profile
Over the past month, multiple analysts have rated the company as Buy, with an average price target of $73.04, a high of $83.00, and a low of $47.00.
More details about Freeport-McMoRan Inc (FCX)
Company Specific Risks:
- Gold Sales Deferral and Unit Cash Cost Expansion: Freeport-McMoRan disclosed in its third-quarter 2026 operational update that timing adjustments at PT Freeport Indonesia deferred approximately 60,000 ounces of refined gold sales into the fourth quarter. This reduced expected third-quarter gold sales to 100,000 ounces and compressed by-product credits, driving estimated unit net cash costs roughly 5% above prior guidance of $2.00 per pound of copper.
- U.S. Mining Weather Disruptions and Operating Deficits: Domestic production across North American assets underperformed planned quarterly throughput due to localized flooding, power grid failures, and severe winds, creating domestic operational bottlenecks that offset stronger international copper extraction.
- Grasberg Underground Production Capacity Limits: Mill throughput at the flagship Grasberg Block Cave mine averaged 140,000 metric tons of ore per day in the third quarter, leaving underground production capped at approximately 67% of normalized pre-incident capacity and dependent on material handling infrastructure overhauls extending into early 2027.
- Elevated Valuation Multiple Vulnerability: Market evaluation metrics highlight that FCX trades at a high price-to-earnings ratio of approximately 34x compared to the broader metals and mining sector benchmark of 20x, exposing the equity to valuation rerating risks if global commodity pricing or operational execution falters.
This article may include AI-generated content that is human-reviewed, which is for reference and general information purposes only and does not constitute investment advice.
Recommended Articles









Comments (0)
Click the $ button, enter the symbol, and select to link a stock, ETF, or other ticker.