


Texas Instruments Inc Stock (TXN) Moved Up by 4.43% on Oct 2: Key Drivers Unveiled



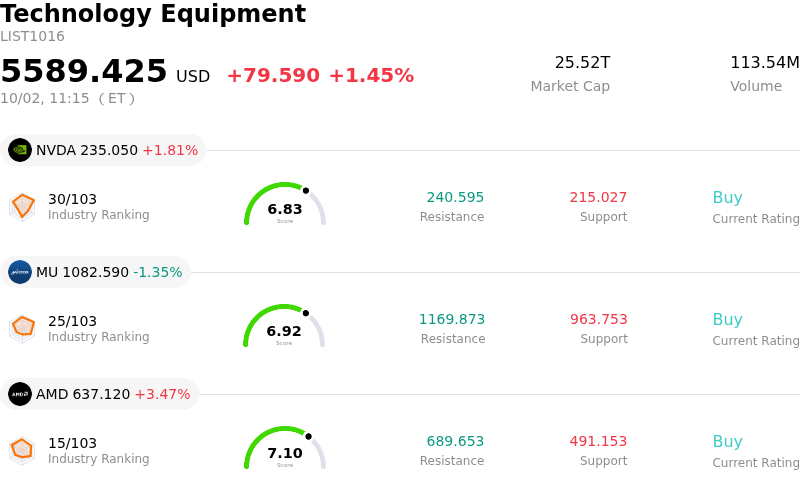
Texas Instruments Inc (TXN) moved up by 4.43%. The Technology Equipment sector is up by 1.45%. The company outperformed the industry. Top 3 stocks by turnover in the sector: NVIDIA Corp (NVDA) up 1.75%; Micron Technology Inc (MU) down 1.49%; Advanced Micro Devices Inc (AMD) up 3.31%.
What is driving Texas Instruments Inc (TXN)’s stock price up today?
The upward movement in Texas Instruments stock is primarily driven by mounting investor enthusiasm surrounding the company's expanding role in artificial intelligence infrastructure. Market sentiment gained strong traction following research highlighting analog chipmakers as key, overlooked beneficiaries of the global AI build-out. With increased power management and high-precision signal needs across data centers and next-generation compute hardware, institutional investors are reassessing Texas Instruments' long-term demand curve in AI-adjacent applications beyond its traditional industrial and automotive footprints.
In addition to the AI macro tailwinds, corporate execution and pricing actions have bolstered fundamental confidence. Portfolio-wide price adjustments implemented entering October signal stabilizing end-market demand and enhanced pricing leverage within the broader semiconductor cycle. Furthermore, Texas Instruments expanded its technological ecosystem by elevating its status within open-source embedded standards through Platinum Membership in the Zephyr Project. This step reinforces the deeper integration of its microcontroller and embedded processing portfolios into connected systems, robotics, and edge-computing devices.
Supporting the positive backdrop is management's ongoing commitment to capital return, highlighted by a recent quarterly dividend increase that demonstrates baseline cash flow durability and operational strength. While long-term investors welcome the broad, diversified revenue mix, market participants continue to monitor the overall pace of cyclical end-market recovery and capital expenditure trends. Nevertheless, the convergence of favorable pricing execution, growing AI infrastructure exposure, and disciplined shareholder return strategies continues to drive institutional buying interest.
Technical Analysis of Texas Instruments Inc (TXN)
Technically, Texas Instruments Inc (TXN) shows a MACD (12,26,9) value of 5.919, indicating a buy signal. The RSI at 70.428 suggests buy condition and the Williams %R at 4.975 suggests overbought condition. Please monitor closely.
Media Coverage of Texas Instruments Inc (TXN)
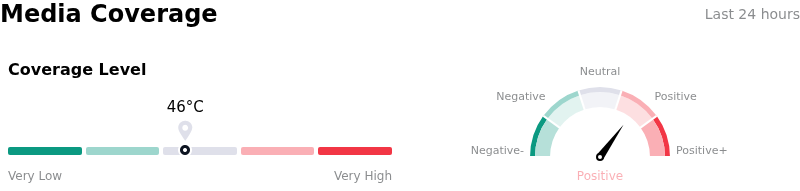
In terms of media coverage, Texas Instruments Inc (TXN) shows a coverage score of 46, indicating a moderate level of media attention. The overall market sentiment index is currently in bullish zone.
Fundamental Analysis of Texas Instruments Inc (TXN)
Texas Instruments Inc (TXN) is in the Technology Equipment industry. Its latest annual revenue is $17.68B, ranking 14 in the industry. The net profit is $4.97B, ranking 10 in the industry. Company Profile
Over the past month, multiple analysts have rated the company as Buy, with an average price target of $309.53, a high of $400.00, and a low of $184.59.
More details about Texas Instruments Inc (TXN)
Company Specific Risks:
- Elevated Valuation Premium and DCF Mismatch: Texas Instruments is trading at a trailing P/E ratio of approximately 42.9x—far above its 5-year historical median of 25.4x—with discounted cash flow models estimating the stock to be roughly 19% overvalued relative to intrinsic value ($236.73 vs. $281.69), leaving no margin for safety if market sentiment deteriorates.
- Free Cash Flow Constraint and Subsidies Dependence: Following a 7% dividend increase to $1.52 per share, total cash returns ($5.82 billion) closely track free cash flow, which relies heavily on $1.18 billion of non-operational U.S. CHIPS Act incentive proceeds; any delays or reductions in federal policy benefits could constrain cash allocation and risk dividend coverage.
- 300mm Fab Expansion and Oversupply Risk: Aggressive capital expenditures on expanding in-house 300mm wafer fabrication capacity introduce operating leverage risk; if cyclical demand across industrial and automotive end-markets moderates, underutilized factory capacity and elevated inventory levels will trigger severe gross margin compression.
- Sustained Executive Insider Selling: Regulatory disclosures indicate ongoing insider selling totaling over $119 million over the past 12 months with zero insider purchases, signaling that company executives and insiders may perceive the stock's recent price appreciation as fully valued relative to underlying operational metrics.
This article may include AI-generated content that is human-reviewed, which is for reference and general information purposes only and does not constitute investment advice.
Recommended Articles









Comments (0)
Click the $ button, enter the symbol, and select to link a stock, ETF, or other ticker.