


Sumitomo Mitsui Financial Group Inc Stock (SMFG) Moved Down by 3.86% on Oct 1: What Signal Does It Send?



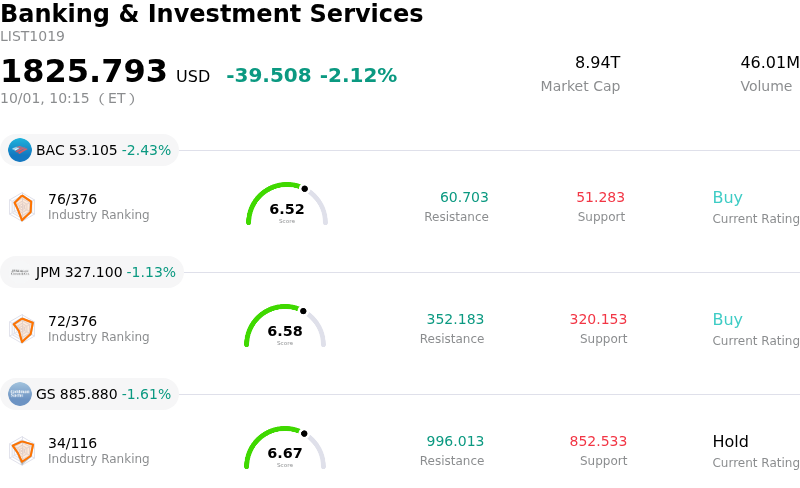
Sumitomo Mitsui Financial Group Inc (SMFG) moved down by 3.86%. The Banking & Investment Services sector is down by 2.12%. The company underperformed the industry. Top 3 stocks by turnover in the sector: Bank of America Corp (BAC) down 2.51%; JPMorgan Chase & Co (JPM) down 1.26%; Goldman Sachs Group Inc (GS) down 1.61%.
What is driving Sumitomo Mitsui Financial Group Inc (SMFG)’s stock price down today?
Sumitomo Mitsui Financial Group faced downward pressure alongside a broader retrenchment across the global financial sector. Persistent volatility in benchmark government bond yields and shifting global monetary policy expectations have created a cautious environment for major banking institutions. Investors scaled back exposure to international lenders as elevated global yield volatility and macro uncertainty prompted a general risk-off rotation away from financial equities.
A primary catalyst for the movement relates to corporate calendar dynamics, particularly the stock trading past its ex-dividend date. Following the cutoff for dividend eligibility, shares typical undergo a technical adjustment to reflect the payout value. Furthermore, ongoing fluctuations in the exchange rate between the Japanese yen and the U.S. dollar impacted the American Depositary Receipt structure, adding secondary pressure to dollar-denominated valuation.
The decline also points to routine profit-taking following a period of strong performance that brought the stock near multi-year highs. While core operational fundamentals remain backed by solid profitability, resilient net margin expansion from domestic monetary policy normalization, and ongoing strategic expansion, short-term price action was dictated by broader sector profit distribution and portfolio rebalancing.
Technical Analysis of Sumitomo Mitsui Financial Group Inc (SMFG)
Technically, Sumitomo Mitsui Financial Group Inc (SMFG) shows a MACD (12,26,9) value of -0.338, indicating a neutral signal. The RSI at 39.922 suggests neutral condition and the Williams %R at 98.577 suggests oversold condition. Please monitor closely.
Fundamental Analysis of Sumitomo Mitsui Financial Group Inc (SMFG)
Sumitomo Mitsui Financial Group Inc (SMFG) is in the Banking & Investment Services industry. Its latest annual revenue is $39.34B, ranking 11 in the industry. The net profit is $10.50B, ranking 11 in the industry. Company Profile
Over the past month, multiple analysts have rated the company as , with an average price target of $31.51, a high of $31.51, and a low of $31.51.
More details about Sumitomo Mitsui Financial Group Inc (SMFG)
Company Specific Risks:
- Earnings Guidance Disconnect: A significant gap between full-year earnings per share guidance of $0.842 and institutional consensus estimates of $1.520 has heightened analyst skepticism, fueling an increase in short interest to over 7.39 million shares.
- Corporate Restructuring Execution Risks: SEC Form 6-K filings disclosing a statutory share exchange to establish SMBC Nikko Securities Holdings Inc. as an intermediate holding company create operational execution risks and corporate governance complexities across wholesale equities.
- Elevated Financial Leverage and Thin Credit Buffer: The bank operates with a high debt-to-equity ratio of 1.65 and trades above sector average P/E multiples, leaving its balance sheet vulnerable to sudden credit quality degradation due to relatively low bad-loan loss provisions.
- Yield Curve Volatility and Trading Margin Exposure: Volatility in Japanese Government Bond yields alongside fluctuating global Treasury yields has created substantial quarterly swings in trading revenues and heightened carry trade unwinding risks.
This article may include AI-generated content that is human-reviewed, which is for reference and general information purposes only and does not constitute investment advice.
Recommended Articles








Comments (0)
Click the $ button, enter the symbol, and select to link a stock, ETF, or other ticker.