


Bitcoin (BTCUSD) Suddenly Goes down 1.03% on Sep 28: What's Driving This



Bitcoin (BTCUSD) is down 1.03% at Sep 28 22:00(ET), now at $83652.08, with a 7-day down of 3.82%.
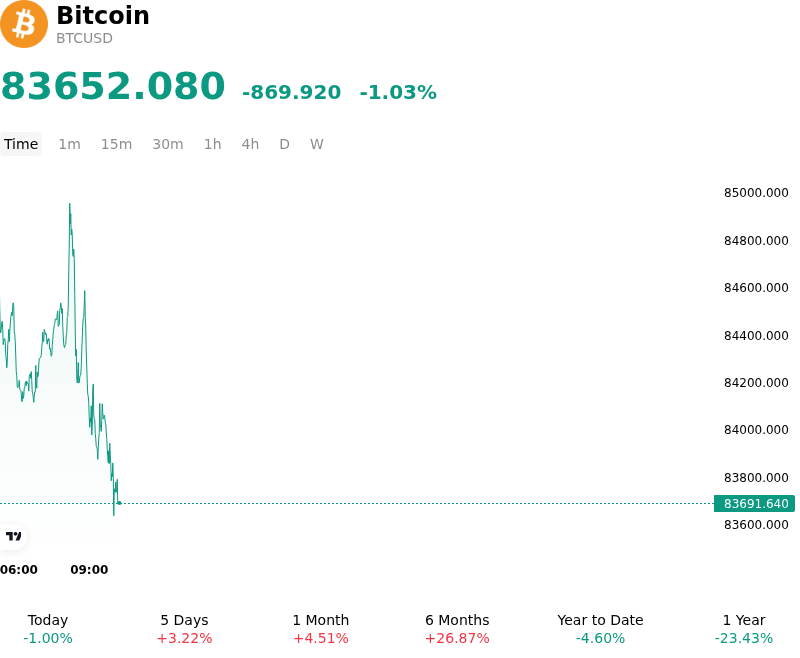
What is driving Bitcoin (BTCUSD)’s stock price down today?
The primary catalyst weighing on Bitcoin stems from persistent macroeconomic pressures following the Federal Reserve's recent monetary policy tightening and the ongoing firming of benchmark U.S. Treasury yields. With benchmark yields hovering at elevated multi-month levels, elevated risk-free returns continue to establish a demanding hurdle rate for non-yielding digital assets. This environment has prompted macro-focused institutional desks to exercise caution, temporarily curtailing risk-on capital deployment and favoring fixed-income allocations.
Additionally, market liquidity is navigating a structural reset following the recent settlement of a massive quarterly options expiry. The clearing of substantial options open interest reduced market-maker gamma hedging activity around key resistance levels above the $85,000 threshold. Absent the mechanical delta-buying support from options dealers, the market experienced localized profit-taking and a modest flush of overleveraged long positioning, resulting in downward pressure during session trading.
Institutional flow dynamics also contributed to the pullback as net daily inflows into U.S. spot Bitcoin ETFs showed signs of moderation compared to the aggressive accumulation seen earlier in the month. While spot ETF demand successfully absorbed significant supply throughout September, a temporary deceleration in fresh fund inflows allowed exchange sell-side liquidity to outweigh immediate spot demand, encouraging short-term traders to realize profits following the asset's strong multi-week advance.
Despite the near-term consolidation, long-term market structure remains supported by ongoing corporate treasury acquisitions and broader institutional integration. Market participants continue to closely monitor upcoming macroeconomic indicators, inflation trends, and Treasury market volatility to determine whether the current weakness reflects routine post-expiry consolidation or a more sustained pause in global risk sentiment heading into the fourth quarter.
Technical Analysis of Bitcoin (BTCUSD)
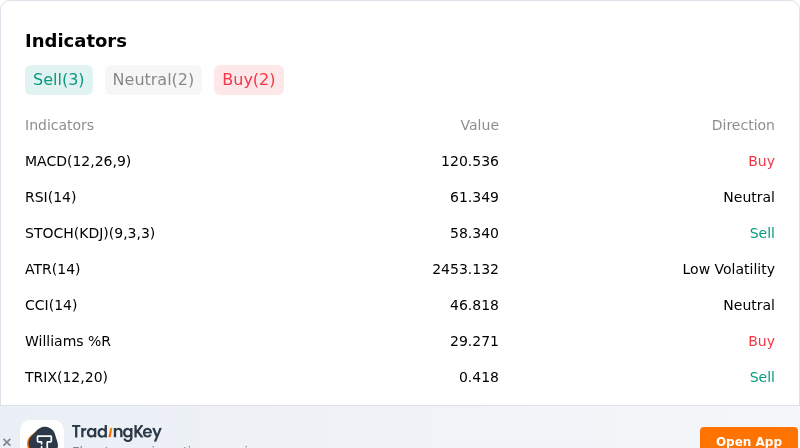
Technically, Bitcoin (BTCUSD) shows a MACD (12,26,9) value of 120.536, indicating a buy signal. The RSI at 61.349 suggests neutral condition and the Williams %R at 29.271 suggests buy condition. Please monitor closely.
More details about Bitcoin (BTCUSD)
Recent Events and Risks:
- Leveraged Long Liquidation Cascades: Price rejection near $87,300 triggered over $350 million in forced long position liquidations across major derivatives venues, contracting open interest and leaving thin order book liquidity vulnerable to sharp intraday downside spikes.
- Macro Tightening and Soaring Treasury Yields: A surge in the U.S. 10-year Treasury yield toward 5.1% following Federal Reserve rate increases has intensified risk-off sentiment across financial markets, dampening the appeal of non-yielding assets like Bitcoin.
- U.S. Legislative Stalls and Regulatory Ambiguity: The procedural failure of the CLARITY Act in the U.S. Senate stripped away anticipated federal statutory clarity for digital commodity spot markets, reigniting regulatory uncertainty and compliance concerns for institutional market participants.
- Quarter-End Rebalancing and Flow Deceleration: A slowdown in U.S. spot Bitcoin ETF net inflows following record highs, combined with quarter-end portfolio rebalancing by institutional asset managers, is generating persistent spot selling pressure to trim overall digital asset exposure.
This article may include AI-generated content that is human-reviewed, which is for reference and general information purposes only and does not constitute investment advice.
Recommended Articles









Comments (0)
Click the $ button, enter the symbol, and select to link a stock, ETF, or other ticker.