


XRP (XRPUSD) Is down 1.63% on Sep 28: What Are the Risk Factors?



XRP (XRPUSD) is down 1.63% at Sep 28 21:50(ET), now at $1.4984, with a 7-day down of 2.24%.
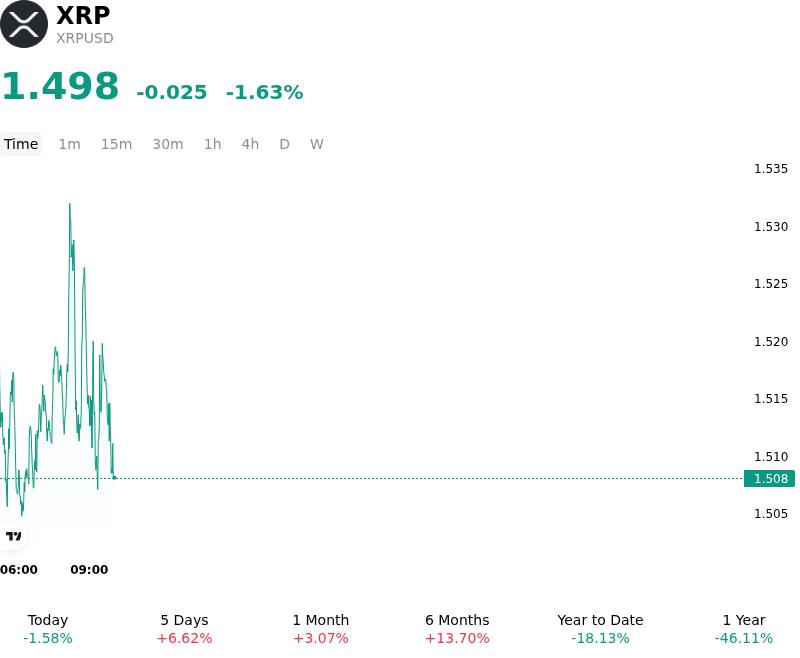
What is driving XRP (XRPUSD)’s stock price down today?
The intraday decline in XRPUSD reflects a mix of technical resistance, quarter-end positioning adjustments, and elevated overhead supply pressure following a strong multi-week advance. As the token tested key multi-month resistance near the upper end of its recent trading range, spot sellers actively reduced exposure. Profit-taking was particularly pronounced among medium-term holders seeking breakeven liquidity near prior entry levels. Despite continued structural demand through spot exchange-traded fund products, intraday capital flows turned net negative as derivative desks unwound long positions and market makers widened spreads to manage short-term order book imbalances.
A central catalyst weighing on short-term market sentiment is the approaching turn-of-the-month escrow release, which programmatically opens access to up to one billion XRP tokens at the start of October. While institutional participants recognize that a significant portion of these programmatic releases is routinely returned to escrow accounts, the potential spot supply creates a recurring psychological hurdle for momentum traders. The timing of this supply window, coinciding with institutional portfolio rebalancing ahead of the third-quarter close, encouraged long liquidation in the perpetual futures market and reduced aggressive bid-side support across major spot exchanges.
From a broader macroeconomic and market structure perspective, the retreat appears to be a localized consolidation within a broader structural recovery rather than a systemic shift in narrative. Global digital asset markets continue to navigate evolving monetary policy expectations and fluctuating liquidity conditions. Institutional engagement across on-chain infrastructure, decentralized finance integrations, and regulated fund vehicles remains resilient. However, until secondary market liquidity can fully absorb overhead supply and break through established technical ceiling zones, XRPUSD remains susceptible to period-end volatility and deleveraging dynamics.
Technical Analysis of XRP (XRPUSD)
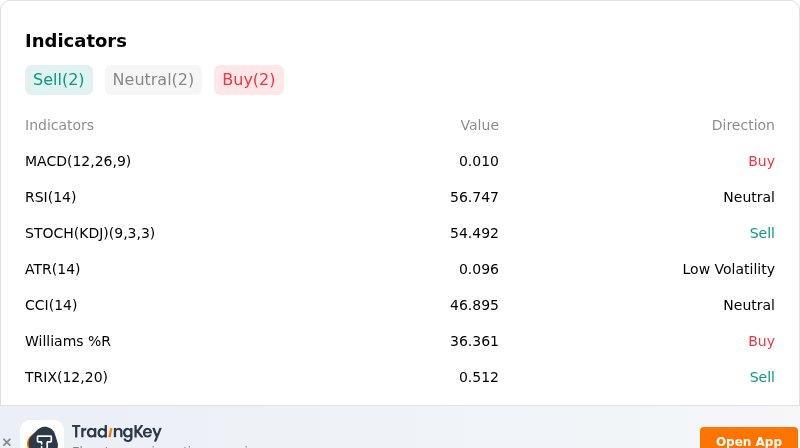
Technically, XRP (XRPUSD) shows a MACD (12,26,9) value of 0.010, indicating a buy signal. The RSI at 56.747 suggests neutral condition and the Williams %R at 36.361 suggests buy condition. Please monitor closely.
More details about XRP (XRPUSD)
Recent Events and Risks:
- Derivatives Long Liquidation Cascade: A sharp technical rejection near the $1.60–$1.65 overhead resistance zone triggered significant long-side liquidations with a 1,522% liquidation imbalance, leaving remaining leverage vulnerable to further downside unwinding if secondary support fails.
- Regulatory Legislative Stagnation: The U.S. Senate's failure to pass procedural cloture on key digital asset market structure legislation removed near-term expectations for explicit CFTC commodity classification, reigniting regulatory policy uncertainty for XRP.
- On-Chain Whale Inflows and Escrow Supply Expectations: Increased large-scale whale deposits onto centralized exchange order books, combined with market anticipation surrounding Ripple's upcoming monthly token escrow releases, have expanded immediate liquid supply and reinforced overhead resistance.
- Macro Headwinds and Deep Downside Liquidity Targets: Rising U.S. Treasury yields and risk-off sentiment across broader crypto markets have constrained aggressive spot dip-buying, raising concerns that market makers may target concentrated downside leverage pools down toward lower support levels near $1.00.
This article may include AI-generated content that is human-reviewed, which is for reference and general information purposes only and does not constitute investment advice.
Recommended Articles









Comments (0)
Click the $ button, enter the symbol, and select to link a stock, ETF, or other ticker.