


Ethereum (ETHUSD) Is down 1.05% on Sep 26: What Do On-Chain Data and Market Sentiment Show?



Ethereum (ETHUSD) is down 1.05% at Sep 26 16:50(ET), now at $2663.67, with a 7-day up of 1.15%.
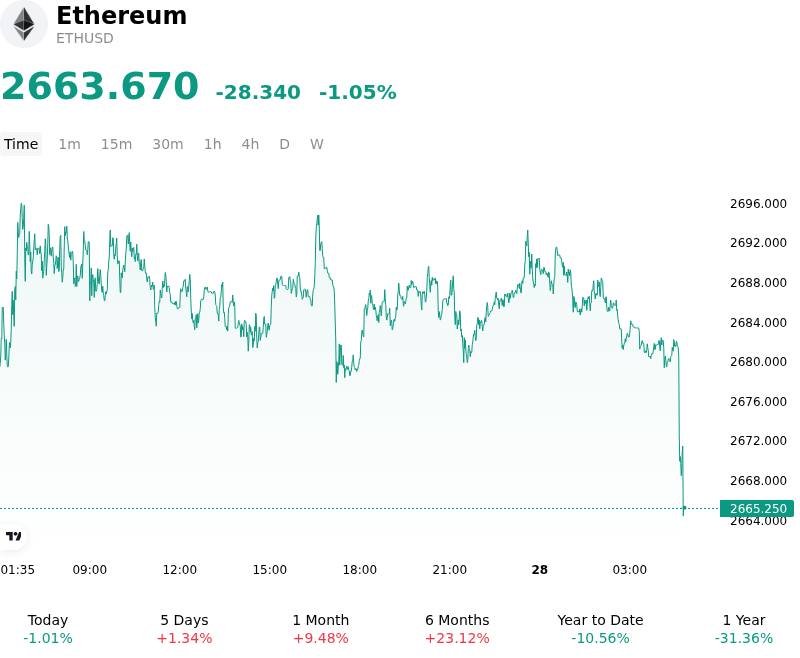
What is driving Ethereum (ETHUSD)’s stock price down today?
Ethereum experienced downside momentum during the trading session as market participants engaged in tactical profit-taking following a multi-day rally that tested heavy technical resistance. The decline was largely driven by a temporary exhaustion of buying pressure near key psychological price ceilings, prompting leveraged long holders in the derivatives market to trim risk exposure. This short-term consolidation triggered a cascade of order-book liquidations in futures and perpetual contracts, exacerbating intraday downward price movement as liquidity thinned.
Institutional capital flows through spot Ethereum ETFs provided a subdued offset to spot market selling pressure, as daily allocations slowed compared to previous high-volume sessions. Macroeconomic conditions also played a key role in moderating institutional risk appetite, with fluctuations in Treasury yields and foreign exchange markets weighing on broader digital asset sentiment. Investors remained cautious ahead of upcoming macroeconomic data releases, evaluating how Federal Reserve monetary policy guidance might impact dollar liquidity and yield-bearing assets over the coming quarter.
On-chain fundamentals and structural metrics continue to reflect underlying network resilience, even as near-term price action remains constrained. Exchange-held supply of Ether has hovered near multi-month lows, indicating that spot selling was primarily driven by derivative speculators and short-term traders rather than long-term asset holders. Furthermore, steady engagement across decentralized finance applications and sustained staking participation continue to lock up circulating supply, limiting broader structural downside risks.
Overall, the pullback represents a typical event-driven tactical pause within an ongoing market consolidation, rather than a fundamental shift in Ethereum’s institutional narrative. While regulatory scrutiny around staking models and short-term derivative rebalancing may keep price volatility elevated in the near term, the long-term outlook remains underpinned by layer-two adoption, tokenization initiatives, and institutional spot product integration. Investors will continue to track spot ETF flow consistency and global macroeconomic liquidity metrics as primary catalysts for the next sustained directional move.
Technical Analysis of Ethereum (ETHUSD)
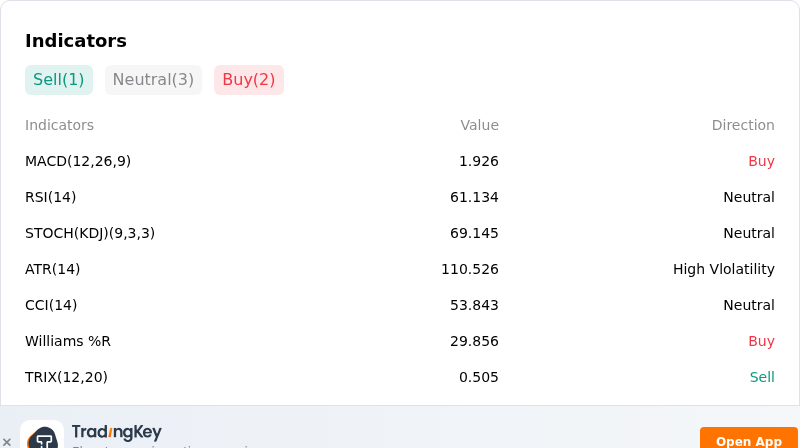
Technically, Ethereum (ETHUSD) shows a MACD (12,26,9) value of 1.926, indicating a buy signal. The RSI at 61.134 suggests neutral condition and the Williams %R at 29.856 suggests buy condition. Please monitor closely.
More details about Ethereum (ETHUSD)
Recent Events and Risks:
- Macro Headwinds and Yield Pressure: Rising U.S. 10-year Treasury yields climbing past 5.10% alongside strong economic data have dampened broad risk-on sentiment, elevating the opportunity cost of holding non-yielding digital assets and placing sell pressure on ETH.
- Derivatives Long Squeeze and Forced Liquidations: Overextended leverage following ETH's retest of overhead resistance triggered over $100 million in long derivative liquidations, forcing order book displacement and accelerating downside intraday volatility below $2,700.
- Technical Resistance Rejection and Key Support Test: A firm rejection near the $2,780–$2,800 price ceiling has shifted short-term market momentum, leaving ETH vulnerable to a breakdown below critical swing support at $2,626 toward the 20-day EMA near $2,550.
- Stalled Legislative Clarification and Regulatory Overhang: The procedural failure of the CLARITY Act in the Senate has prolonged structural legal uncertainty for crypto market infrastructure, keeping market participants reliant on non-binding SEC staff guidance regarding staking and digital asset oversight.
This article may include AI-generated content that is human-reviewed, which is for reference and general information purposes only and does not constitute investment advice.
Recommended Articles








Comments (0)
Click the $ button, enter the symbol, and select to link a stock, ETF, or other ticker.