


Solana (SOLUSD) Is up 1.03% on Sep 23: Key Drivers to Watch



Solana (SOLUSD) is up 1.03% at Sep 23 23:25(ET), now at $118.19, with a 7-day up of 20.96%.
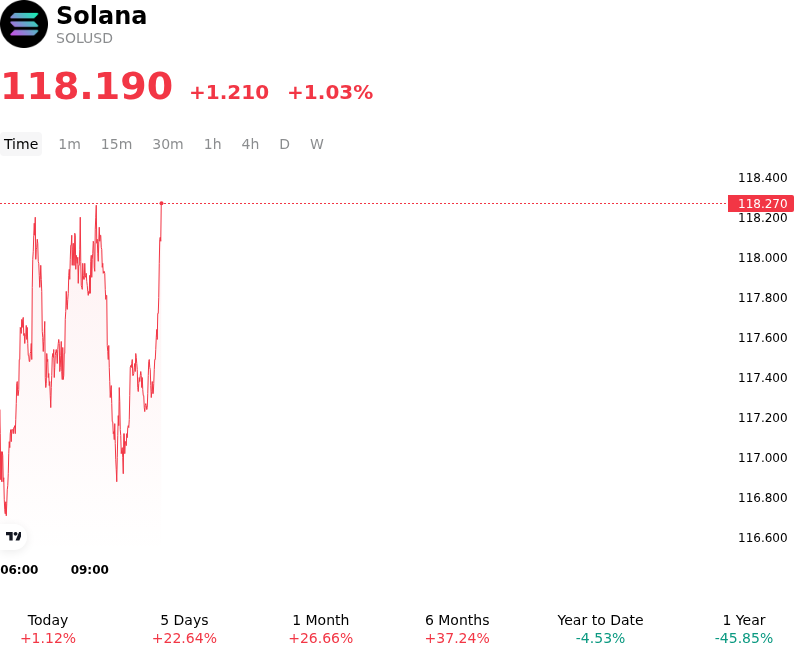
What is driving Solana (SOLUSD)’s stock price up today?
Solana experienced renewed upside expansion as sustained institutional demand and continuous capital allocations into spot exchange-traded products provided a resilient bid. Institutional investors maintained consistent net inflows into Solana spot products, particularly yield-bearing vehicles like the Bitwise Solana Staking ETF. This steady institutional accumulation helped absorb localized retail profit-taking near recent multi-month highs and reduced exchange-located spot supply, tightening circulating sell-side liquidity across major trading venues.
On-chain fundamentals and ecosystem developments provided a strong structural tailwind following recent mainnet protocol enhancements. The deployment of the Transaction Format V1 upgrade expanded maximum serialized transaction limits from 1,232 bytes to 4,096 bytes, significantly increasing execution efficiency for complex smart contracts, zero-knowledge proofs, and batched decentralized finance operations without requiring fragmented transactions. Additionally, protocol adjustments reducing target slot times enhanced block production capacity, reinforcing Solana's competitive positioning in real-world asset tokenization and enterprise application throughput.
From a market structure perspective, the upward momentum was further supported by technical breakout dynamics and derivatives positioning. As the token maintained its foothold above key moving averages, forced short covering in perpetual futures markets accelerated buying pressure. While broader macroeconomic conditions remained sensitive to Federal Reserve monetary policy recalibrations and elevated Treasury yields, Solana demonstrated relative strength among top-tier layer-one assets, driven by robust ecosystem capital inflows and a widening momentum structure on daily technical charts.
Despite the constructive institutional momentum, market participants continue to monitor several potential headwinds. Intermittent surges in spot exchange deposits indicate ongoing profit-taking by short-term market participants, which could induce short-term consolidation. Furthermore, broader global macroeconomic conditions, shifts in risk-asset liquidity, and evolving regulatory frameworks surrounding digital asset market structure remain critical factors influencing long-term institutional capital deployment.
Technical Analysis of Solana (SOLUSD)
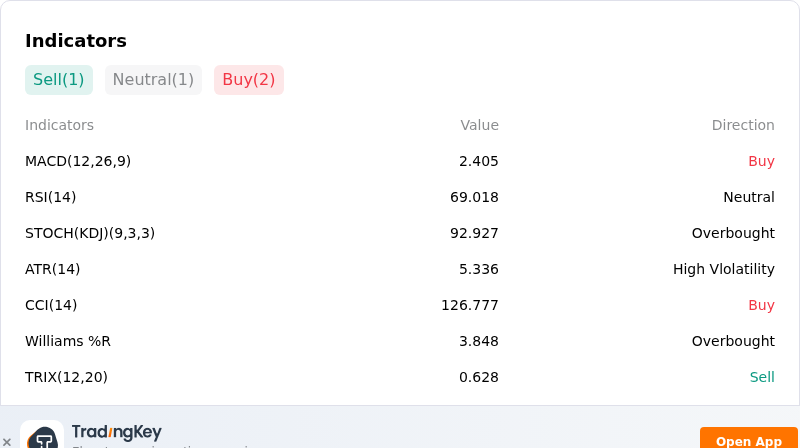
Technically, Solana (SOLUSD) shows a MACD (12,26,9) value of 2.405, indicating a buy signal. The RSI at 69.018 suggests neutral condition and the Williams %R at 3.848 suggests overbought condition. Please monitor closely.
More details about Solana (SOLUSD)
Recent Events and Risks:
- Short-Squeeze Exhaustion and Long Liquidation Exposure: Solana's recent surge to multi-month highs near $118–$119 was primarily propelled by a aggressive short squeeze that wiped out over $20 million in bearish positions. As forced short-covering subsides and futures open interest sits at elevated levels near $7.26 billion, SOL faces acute downside risk from long liquidation cascades if buyers fail to maintain upward momentum above key resistance.
- Technical Resistance and Overbought Momentum Divergence: SOL is confronting heavy supply overhead near the $118–$120 price zone. Intraday technical indicators display overbought conditions and emerging bearish divergence, raising the probability of a swift corrective retracement toward lower support levels at $114 and $110.
- Whale Transfer Volatility and Sell-Side Overhang: Recent on-chain data highlighted large-scale token movements, including a transfer of over 1 million SOL (valued near $110 million) between unidentified wallets. Unannounced high-volume transfers between non-exchange and exchange wallets create persistent overhang risk, threatening sudden spot dumping and price slippage.
- Institutional Flow Volatility and Passive Demand Fragility: Despite spot Solana ETF inflows, institutional capital commitment has demonstrated extreme week-over-week volatility and sharp flow declines. The lack of predictable, sustained institutional buying leaves SOL vulnerable to sharp sell-offs if market sentiment shifts risk-off.
This article may include AI-generated content that is human-reviewed, which is for reference and general information purposes only and does not constitute investment advice.
Recommended Articles










Comments (0)
Click the $ button, enter the symbol, and select to link a stock, ETF, or other ticker.