


Bitcoin (BTCUSD) Is down 1.27% on Sep 22: Why It Happened



Bitcoin (BTCUSD) is down 1.27% at Sep 22 21:10(ET), now at $85870, with a 7-day up of 13.13%.
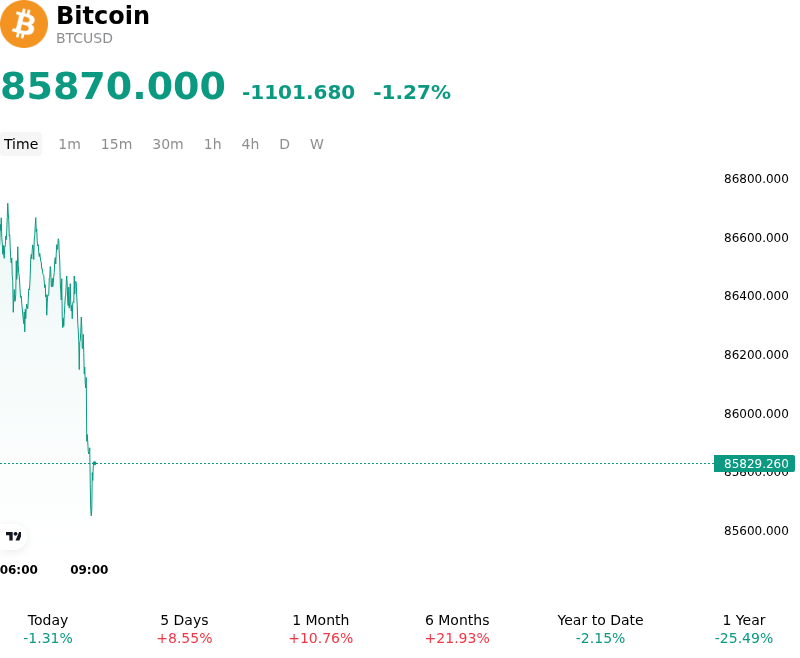
What is driving Bitcoin (BTCUSD)’s stock price down today?
The pullback in Bitcoin reflects tactical profit-taking and the unwinding of derivative leverage following a rapid multi-day advance to multi-month highs. After clearing key overhead resistance levels in recent sessions, buying momentum temporarily paused as derivatives market positioning became overextended. Elevated open interest in perpetual swaps and call options had fueled the prior price expansion, leaving order books susceptible to short-term profit-taking. As tactical traders locked in gains near upper technical boundaries, high-leverage long positions were systematically flushed, exerting localized selling pressure across major spot and perpetual swap venues.
Institutional capital flows also showed signs of short-term moderation following a period of aggressive spot ETF net creations. While institutional spot demand provided strong upward momentum during preceding sessions, a temporary pause in net daily ETF allocations allowed secondary market liquidity to rebalance without immediate absorption by institutional buyers. Concurrently, macro liquidity conditions continue to present a tight backdrop. Sustained firmness in U.S. Treasury yields and market expectations of restrictive Federal Reserve monetary policy continue to lift real discount rates, tempering broader risk appetite and imposing a tactical headwind on non-yielding digital assets.
From a structural perspective, the intraday decline represents a standard leverage reset within a broader market consolidation rather than a fundamental shift in long-term sentiment. Structural demand continues to be anchored by ongoing corporate treasury purchases and positive regulatory developments surrounding tokenized asset frameworks. On-chain metrics indicate that core spot holdings among conviction investors remain intact, establishing a strong fundamental floor. Institutional market participants continue to monitor spot ETF flow consistency, real yield movements, and upcoming central bank rhetoric to gauge the durability of current market structure.
Technical Analysis of Bitcoin (BTCUSD)
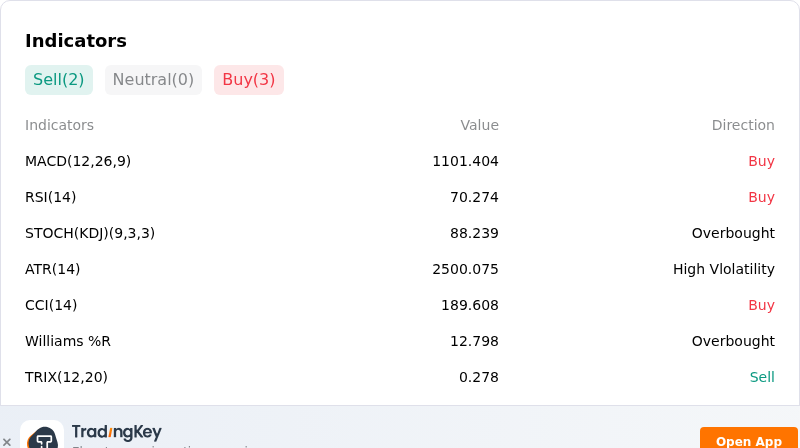
Technically, Bitcoin (BTCUSD) shows a MACD (12,26,9) value of 1113.896, indicating a buy signal. The RSI at 70.631 suggests buy condition and the Williams %R at 12.011 suggests overbought condition. Please monitor closely.
More details about Bitcoin (BTCUSD)
Recent Events and Risks:
- U.S. Legislative and Regulatory Stagnation: The U.S. Senate failed to clear a key procedural vote to advance the Digital Asset Market CLARITY Act, halting progress on establishing a comprehensive regulatory framework between the SEC and CFTC and re-injecting policy uncertainty for institutional investors.
- Substantial Spot ETF Outflows: U.S. spot Bitcoin ETFs experienced heavy net single-day withdrawals reaching $450 million—led by redemptions in major products like Fidelity's FBTC and BlackRock's IBIT—reflecting a sudden pullback in institutional demand and spot market buying power.
- Hawkish Federal Reserve Outlook and Yield Pressures: Ongoing hawkish messaging from the Federal Reserve, expectations of prolonged high benchmark interest rates, and elevated Treasury yields continue to strengthen the U.S. dollar and diminish global risk appetite for non-yielding digital assets.
- Derivatives Backwardation and Liquidation Cascade Exposure: Bitcoin faces persistent overhead technical resistance around $82,000, while elevated options market backwardation and dense leveraged long liquidation clusters between $75,000 and $77,000 present risk of downside acceleration if support fails.
This article may include AI-generated content that is human-reviewed, which is for reference and general information purposes only and does not constitute investment advice.
Recommended Articles








Comments (0)
Click the $ button, enter the symbol, and select to link a stock, ETF, or other ticker.