


Nebius Group NV Stock (NBIS) Moved Up by 5.60% on Sep 21: Facts Behind the Movement



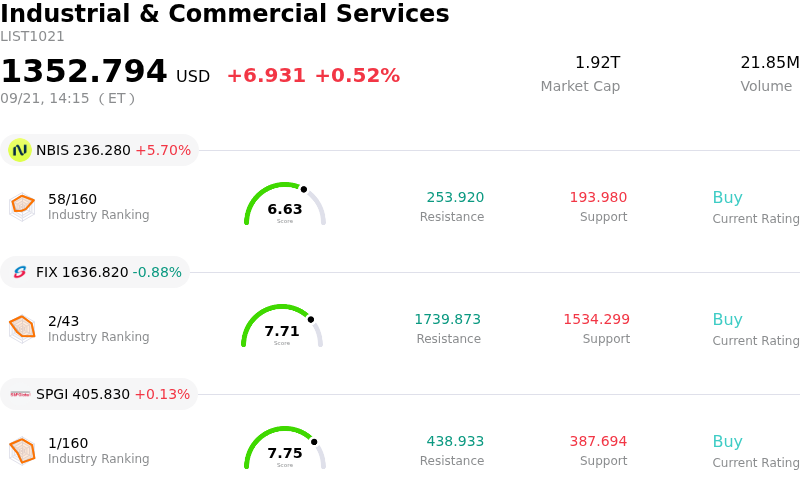
Nebius Group NV (NBIS) moved up by 5.60%. The Industrial & Commercial Services sector is up by 0.52%. The company outperformed the industry. Top 3 stocks by turnover in the sector: Nebius Group NV (NBIS) up 5.70%; Comfort Systems USA Inc (FIX) down 0.88%; S&P Global Inc (SPGI) up 0.13%.
What is driving Nebius Group NV (NBIS)’s stock price up today?
Nebius Group N.V. saw positive price momentum driven primarily by growing market confidence in its pricing power across specialized artificial intelligence cloud computing infrastructure. The enterprise recently announced price increases across its premium Nvidia GPU and AMD CPU compute instances to reflect tight market capacity for high-performance compute clusters and persistent demand from enterprise artificial intelligence developers. By passing along rising hardware and memory costs, the company has reinforced investor conviction in its ability to generate superior top-line expansion in an environment where specialized high-performance capacity remains highly constrained.
From an equity research standpoint, the upcoming rate adjustments directly support operating margin expansion and accelerate the cash flow payback timeline for the company's aggressive data center capital expenditures. Wall Street analysts and institutional investors have reacted favorably to evidence of low customer churn despite price hikes, confirming that enterprise clients prioritize immediate access to advanced compute resources over price sensitivity. Re-accelerating revenue expectations and constructive analyst price target revisions continue to underpin positive broader market sentiment around independent neocloud providers.
The observed intraday volatility highlights active trading and shifting market positioning. Elevated valuation multiples relative to software and legacy cloud peers leave the shares sensitive to broader technology sector swings and short-term profit-taking. Additionally, institutional investors remain vigilant regarding the capital intensity required for ongoing infrastructure buildouts, supply chain availability, and competitive dynamics against major hyperscalers, leading to wider price swings during trading sessions even as the primary trend remains positive.
Technical Analysis of Nebius Group NV (NBIS)
Technically, Nebius Group NV (NBIS) shows a MACD (12,26,9) value of 1.219, indicating a buy signal. The RSI at 56.523 suggests neutral condition and the Williams %R at 30.797 suggests buy condition. Please monitor closely.
Fundamental Analysis of Nebius Group NV (NBIS)
Nebius Group NV (NBIS) is in the Industrial & Commercial Services industry. Its latest annual revenue is $529.80M, ranking 113 in the industry. The net profit is $82.50M, ranking 74 in the industry. Company Profile
Over the past month, multiple analysts have rated the company as Buy, with an average price target of $287.48, a high of $410.00, and a low of $144.00.
More details about Nebius Group NV (NBIS)
Company Specific Risks:
- Capital Structure Dilution and Debt Accumulation: Market sentiment remains constrained by Nebius's $4.5 billion private offering of convertible senior notes across two tranches, marking its third debt offering over $1 billion in under a year. Concurrent exchanges of convertible debt for Class A equity and long-term debt near $9.5 billion maintain significant equity dilution risks and balance sheet leverage concerns.
- Bottom-Line Losses Driven by Immense CapEx Commitments: Despite generating $582.3 million in Q2 revenue, Nebius reported a net loss of $190 million due to escalating operating expenses. Management's capital expenditure guidance of $20 billion to $25 billion for 2026 to secure hardware and expand data center footprint severely constrains cash flow generation.
- Customer Friction From On-Demand Compute Price Hikes: Nebius notified customers of upcoming rate increases across its on-demand Nvidia GPU and AMD CPU cloud services starting October 1, 2026, to counter rising procurement costs for memory and servers. Raising price points on core compute capacity creates client retention risks and opens competitive vulnerabilities to rival neocloud providers.
- Premium Valuation Exposure and Elevated Short-Selling Pressure: The stock trades at an expensive forward P/E multiple of approximately 45 while remaining down over 20% from its 52-week peak. Institutional short interest near 19% of float—driven by persistent short-seller focus on leverage risks and capital commitments—exacerbates intraday downside volatility.
This article may include AI-generated content that is human-reviewed, which is for reference and general information purposes only and does not constitute investment advice.
Recommended Articles







Comments (0)
Click the $ button, enter the symbol, and select to link a stock, ETF, or other ticker.