


Solana (SOLUSD) Is up 1.32% on Sep 21: Here Is Why



Solana (SOLUSD) is up 1.32% at Sep 21 20:05(ET), now at $110.57, with a 7-day up of 7.37%.
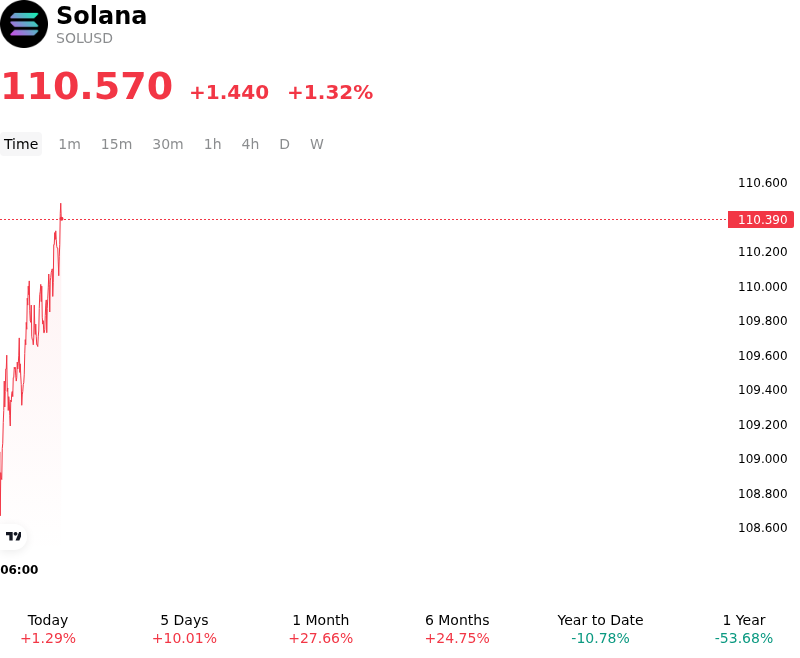
What is driving Solana (SOLUSD)’s stock price up today?
Institutional demand and sustained capital allocation into spot Solana funds remain a cornerstone of the token's upward trajectory. Continued inflows into regulated spot Solana investment vehicles, particularly staking-focused exchange-traded products, have provided consistent buy-side liquidity that continues to absorb market selling pressure. This structural institutional bid has reinforced Solana's standing as a premier Layer-1 network, encouraging capital rotation from broader digital asset markets into high-throughput smart contract platforms as institutional and sophisticated investors seek yield and performance advantages.
Underpinning this price strength is tangible progress on the protocol's core technological roadmap. The mainnet advancement of the SIMD-0525 upgrade, which reduces target block slot times down to 250 milliseconds, has substantially lowered confirmation latency and expanded network processing capacity. Accompanied by the rollout of the expanded Transaction V1 format, these core engineering enhancements significantly improve execution efficiency for latency-sensitive applications, decentralized finance protocols, and automated trading venues. These network improvements coincide with robust on-chain expansion, marked by record activity in daily active stablecoin addresses and steady capital inflows into tokenized real-world assets, signaling that network performance gains are translating into measurable fundamental adoption.
From a broader market structure perspective, derivatives positioning has expanded alongside on-chain metrics, with rising open interest reflecting heightened institutional conviction and speculative participation. Despite macroeconomic headwinds and shifting monetary policy expectations following recent Federal Reserve interest rate adjustments, Solana has shown market-leading resilience driven by asset-specific catalysts. However, institutional investors continue to monitor potential leverage liquidations in derivatives markets, network stability during high-throughput utilization, and broader macroeconomic risk appetite that could influence risk-asset valuations over the medium term.
Technical Analysis of Solana (SOLUSD)
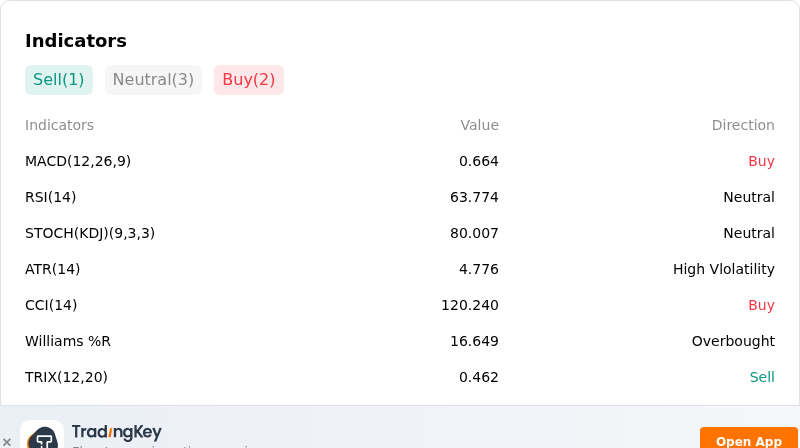
Technically, Solana (SOLUSD) shows a MACD (12,26,9) value of 0.661, indicating a buy signal. The RSI at 63.755 suggests neutral condition and the Williams %R at 16.757 suggests overbought condition. Please monitor closely.
More details about Solana (SOLUSD)
Recent Events and Risks:
- Macro Tightening and Legislative Setbacks: Fading momentum following the failure to advance the US CLARITY Act alongside elevated Federal Reserve interest rate expectations and high Treasury yields have triggered broad risk-off sentiment, disproportionately dragging down high-beta altcoins like SOL.
- Concentrated Long Liquidation Clusters Near Key Support: Dense pools of leveraged long positions are clustered around the critical $98.00–$100.00 support threshold, where a sustained breakdown threatens to unleash forced liquidation cascades toward lower technical targets near $94.00.
- Derivatives Imbalance and Elevated Leverage Beta: Asymmetric long positioning across major futures exchanges exposes SOL to heightened intraday volatility, as subdued spot market volume fails to absorb swift leverage unwinds when broader market sentiment sours.
- Bearish Technical Momentum and Moving Average Pressure: SOL continues to trade below short-term moving averages with negative readings across MACD and ADX indicators, signaling sustained downside sell pressure and persistent chart weakness.
This article may include AI-generated content that is human-reviewed, which is for reference and general information purposes only and does not constitute investment advice.
Recommended Articles








Comments (0)
Click the $ button, enter the symbol, and select to link a stock, ETF, or other ticker.