


Lam Research Corp Stock (LRCX) Opened Up by 4.12% on Sep 18: Facts Behind the Movement



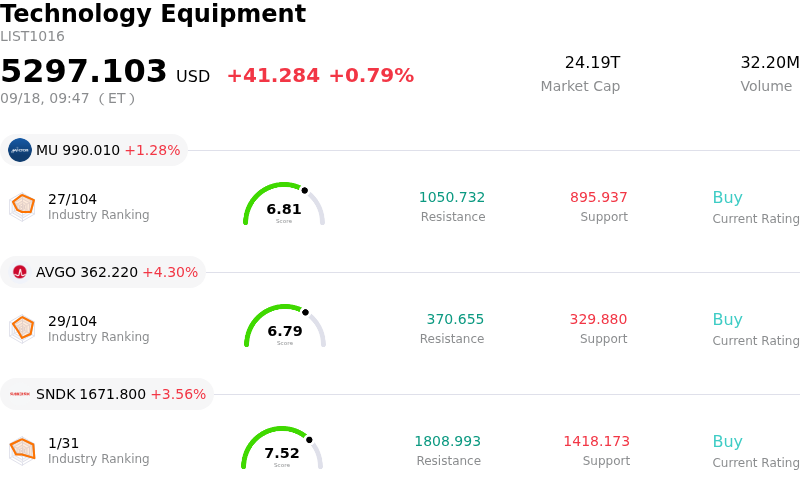
Lam Research Corp (LRCX) opened up by 4.12%. The Technology Equipment sector is up by 0.79%. The company outperformed the industry. Top 3 stocks by turnover in the sector: Micron Technology Inc (MU) up 1.44%; Broadcom Inc (AVGO) up 4.16%; SanDisk Corporation (SNDK) up 3.56%.
What is driving Lam Research Corp (LRCX)’s stock price up today?
Lam Research experienced notable intraday volatility and strong upward momentum as buyers stepped in following a multi-week pullback across the semiconductor equipment sector. Having recently tested technical support near its long-term moving average after entering oversold technical territory, the stock attracted opportunistic dip-buyers looking to capitalize on compressed valuations relative to the company's robust long-term growth outlook.
Investor sentiment was further bolstered by strategic corporate headlines highlighting the company's long-term expansion plans. Reports revealed a planned $1.2 billion investment in India to construct semiconductor component manufacturing facilities under the country's domestic chip initiative, alongside previously announced multi-billion-dollar commitments to expand its global research lab network. These moves reinforce the company's proactive efforts to strengthen its supply chain and capture expanding global wafer-fabrication tool demand.
From a broader industry perspective, despite near-term volatility linked to macroeconomic policy uncertainty and debates regarding chipmaker capital expenditure timing, long-term fundamentals remain sound. The demand for advanced etch and deposition equipment continues to be anchored by artificial intelligence infrastructure buildouts, high-bandwidth memory adoption, and multi-year semiconductor fab investments. The convergence of technical support, strategic global footprint expansion, and durable secular tailwinds in memory and logic chip manufacturing drove the positive shift in trading sentiment.
Technical Analysis of Lam Research Corp (LRCX)
Technically, Lam Research Corp (LRCX) shows a MACD (12,26,9) value of -5.908, indicating a sell signal. The RSI at 41.262 suggests neutral condition and the Williams %R at 76.232 suggests sell condition. Please monitor closely.
Media Coverage of Lam Research Corp (LRCX)
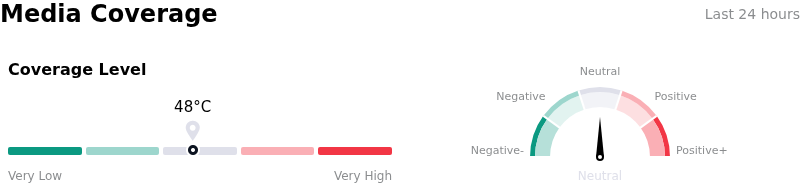
In terms of media coverage, Lam Research Corp (LRCX) shows a coverage score of 48, indicating a moderate level of media attention. The overall market sentiment index is currently in neutral zone.
Fundamental Analysis of Lam Research Corp (LRCX)
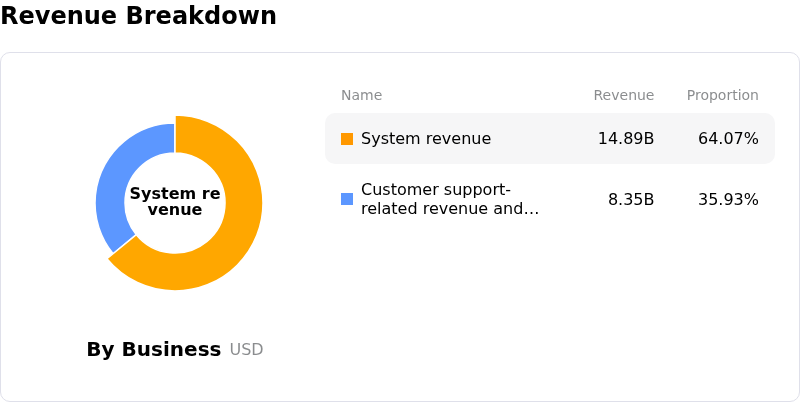
Lam Research Corp (LRCX) is in the Technology Equipment industry. Its latest annual revenue is $23.23B, ranking 12 in the industry. The net profit is $7.27B, ranking 7 in the industry. Company Profile
Over the past month, multiple analysts have rated the company as Buy, with an average price target of $368.22, a high of $500.00, and a low of $213.00.
More details about Lam Research Corp (LRCX)
Company Specific Risks:
- Geopolitical Trade Exposure and Export Controls: Lam Research faces severe revenue risk from tightening U.S. export control regulations and foreign affiliate trade rules, as customer concentration in China accounts for approximately a third of system revenues, making equipment deliveries highly vulnerable to geopolitical trade policy shifts.
- Valuation Multiples and Compression Vulnerability: With a trailing price-to-earnings ratio hovering around 47x—roughly double its historical five-year median—the company faces heightened multiple compression risk and sector profit-taking when semiconductor cycles or broader technology market conditions soften.
- Persistent Insider Stock Dispositions: Recent SEC Form 4 filings revealed significant insider liquidation, including a 31% position cut by Director Bethany Mayer and over $175 million in net insider selling over the past 12 months without any open-market purchases, weakening institutional sentiment.
- Technical Breakdown and Negative Momentum: The stock experienced severe technical momentum deterioration after breaking below its key 50-day moving average and triggering negative MACD crossovers, signaling institutional exit pressure following an aggressive multi-month rally.
This article may include AI-generated content that is human-reviewed, which is for reference and general information purposes only and does not constitute investment advice.
Recommended Articles








Comments (0)
Click the $ button, enter the symbol, and select to link a stock, ETF, or other ticker.