


Diamondback Energy Inc Stock (FANG) Moved Down by 8.28% on Sep 16: Key Drivers Unveiled



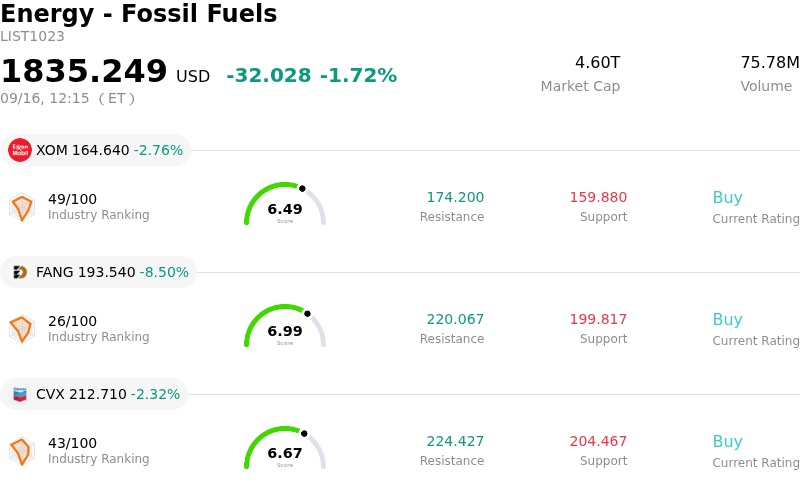
Diamondback Energy Inc (FANG) moved down by 8.28%. The Energy - Fossil Fuels sector is down by 1.72%. The company underperformed the industry. Top 3 stocks by turnover in the sector: Exxon Mobil Corp (XOM) down 2.76%; Diamondback Energy Inc (FANG) down 8.41%; Chevron Corp (CVX) down 2.32%.
What is driving Diamondback Energy Inc (FANG)’s stock price down today?
The primary catalyst behind the sharp downward movement in Diamondback Energy is a major macro-industry drag stemming from a significant downward revision to global oil demand forecasts by the International Energy Agency. In its latest report, the agency sharply reduced its global consumption outlook, citing structural demand headwinds and economic sluggishness. As the largest pure-play exploration and production company in the Permian Basin, Diamondback Energy is directly exposed to global crude price expectations. The severe demand cut triggered a broad sell-off across upstream energy equities and Permian shale producers, dragging the stock down in tandem with falling energy commodities.
Exacerbating the industry-wide weakness, broader macroeconomic factors created a challenging backdrop for equities across the board. Persistent inflation concerns and rising benchmark Treasury yields applied significant pressure on capital-intensive energy producers. Furthermore, heightened market volatility and cautious positioning ahead of the Federal Reserve's interest rate policy announcement prompted institutional investors to trim exposure to higher-beta commodity stocks. The combination of macro uncertainty, tight monetary conditions, and escalating yield pressures reduced risk appetite and amplified selling momentum throughout the session.
Company-specific factors and sentiment headwinds also weighed on investor confidence. Recent regulatory filings revealed notable insider share sales by executive leadership, which raised questions among investors about short-term upside potential following the stock's strong multi-year performance. Additionally, market sentiment turned more cautious as analysts highlighted elevated earnings multiples relative to traditional exploration and production peers, making the stock particularly vulnerable to profit-taking during sector-wide pullbacks. While long-term operational efficiency and Permian acreage quality remain intact, these near-term factors collectively drove severe intraday selling pressure.
Technical Analysis of Diamondback Energy Inc (FANG)
Technically, Diamondback Energy Inc (FANG) shows a MACD (12,26,9) value of -0.959, indicating a neutral signal. The RSI at 42.135 suggests neutral condition and the Williams %R at 88.353 suggests oversold condition. Please monitor closely.
Media Coverage of Diamondback Energy Inc (FANG)
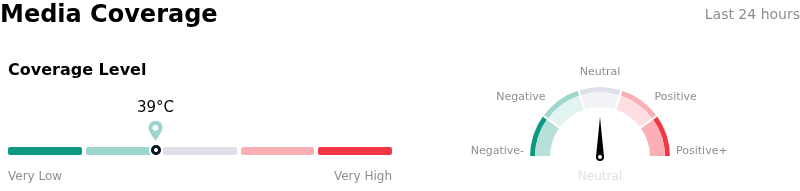
In terms of media coverage, Diamondback Energy Inc (FANG) shows a coverage score of 39, indicating a low level of media attention. The overall market sentiment index is currently in neutral zone.
Fundamental Analysis of Diamondback Energy Inc (FANG)
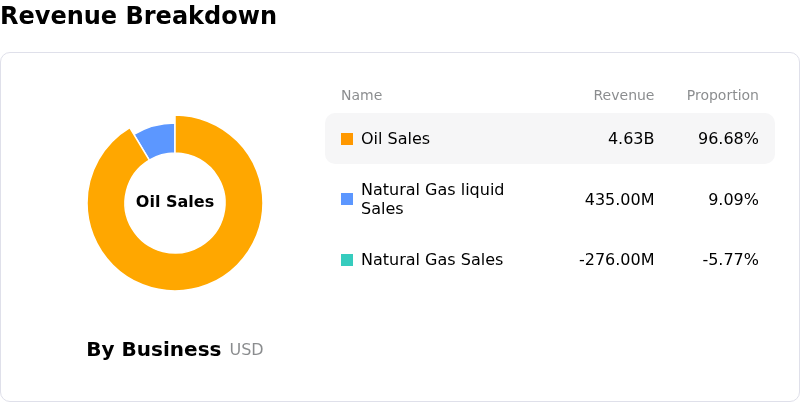
Diamondback Energy Inc (FANG) is in the Energy - Fossil Fuels industry. Its latest annual revenue is $15.03B, ranking 30 in the industry. The net profit is $1.66B, ranking 25 in the industry. Company Profile
Over the past month, multiple analysts have rated the company as Buy, with an average price target of $231.30, a high of $283.00, and a low of $193.00.
More details about Diamondback Energy Inc (FANG)
Company Specific Risks:
- Macro Demand Shock and Crude Volatility: FANG experienced sharp intraday downside after the International Energy Agency issued a significant downward revision to global oil demand growth, directly pressuring crude benchmarks and revenues for pure-play Permian producers.
- Substantial Insider Liquidation Filings: Recent SEC Form 4 and Rule 144 filings disclosed that Director Travis Stice sold 75,000 shares valued at over $15.3 million—a 60% reduction in his direct holdings—alongside additional sell notices filed by corporate officers, dampening institutional confidence.
- Margin Compression and Operating Cost Inflation: Financial performance metrics highlight a depressed gross margin of 46.41%, pointing to operational cost control challenges caused by Permian Basin service equipment inflation and regional natural gas takeaway constraints.
- Valuation Premium and FCF Growth Slowdown: Wall Street analysts have highlighted valuation risks with the stock trading at a high earnings multiple above 39x, warning that projected increases in capital expenditure could constrain free cash flow growth relative to exploration peers.
This article may include AI-generated content that is human-reviewed, which is for reference and general information purposes only and does not constitute investment advice.
Recommended Articles







Comments (0)
Click the $ button, enter the symbol, and select to link a stock, ETF, or other ticker.