


Goldman Sachs Group Inc Stock (GS) Moved Down by 3.13% on Sep 15: Drivers Behind the Movement



Goldman Sachs Group Inc (GS) moved down by 3.13%. The Banking & Investment Services sector is down by 1.33%. The company underperformed the industry. Top 3 stocks by turnover in the sector: Bank of America Corp (BAC) down 0.46%; Goldman Sachs Group Inc (GS) down 3.13%; Wells Fargo & Co (WFC) up 0.10%.
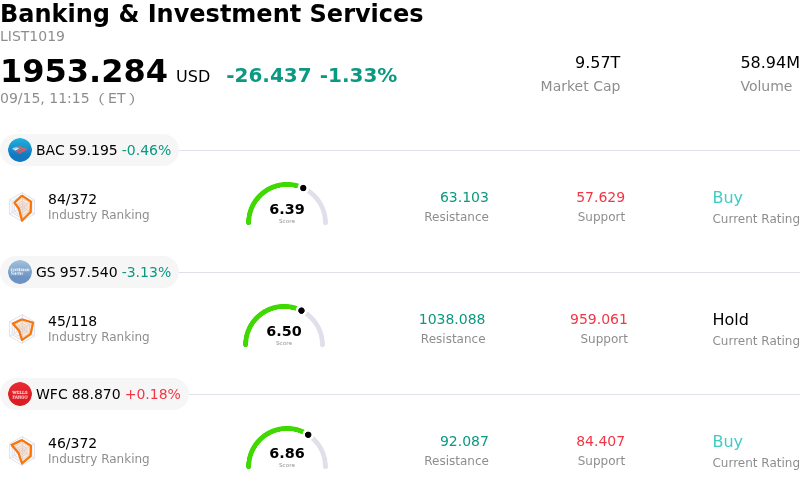
What is driving Goldman Sachs Group Inc (GS)’s stock price down today?
Shares of Goldman Sachs experienced notable intraday volatility and closed lower, driven primarily by macroeconomic crosscurrents, interest rate uncertainty, and sector-wide repricing across capital markets leaders. Elevated benchmark bond yields and evolving expectations regarding Federal Reserve policy have heightened market caution, placing short-term pressure on investment banking and capital markets sentiment. As equity markets digest shifting rate expectations, financials with high exposure to dealmaking and corporate advisory have faced heightened sensitivity from institutional investors.
From an operational perspective, the decline occurs despite positive strategic momentum in the firm's asset management business, including major new fundraising announcements across flagship private equity and alternative investment vehicles. However, market participants remain closely focused on the pace of capital deployment, merger and acquisition advisory revenues, and equity underwriting backlogs. Persistent borrowing cost pressures continue to create temporary hesitation among corporate boards and private equity sponsors, leading investors to price in a more measured timeline for a full recovery in investment banking fees.
Additionally, valuation considerations have contributed to the profit-taking activity observed during the session. Having recently traded near upper historical valuation multiples relative to earnings, the stock faced intensified selling pressure as broader equity indices pulled back. While the firm maintains a strong fundamental foundation, robust capital position, and ongoing expansion in recurring wealth management fees, short-term share performance remains tightly bound to broader market liquidity conditions and upcoming macroeconomic catalysts.
Technical Analysis of Goldman Sachs Group Inc (GS)
Technically, Goldman Sachs Group Inc (GS) shows a MACD (12,26,9) value of -10.517, indicating a sell signal. The RSI at 33.807 suggests neutral condition and the Williams %R at 99.673 suggests oversold condition. Please monitor closely.
Media Coverage of Goldman Sachs Group Inc (GS)
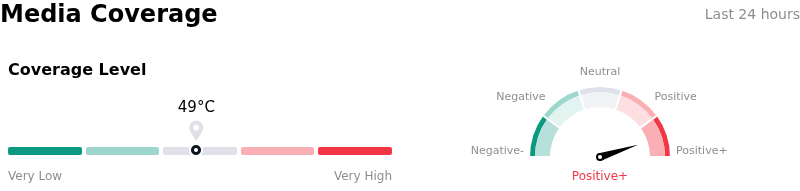
In terms of media coverage, Goldman Sachs Group Inc (GS) shows a coverage score of 49, indicating a moderate level of media attention. The overall market sentiment index is currently in extremely bullish zone.
Fundamental Analysis of Goldman Sachs Group Inc (GS)
Goldman Sachs Group Inc (GS) is in the Banking & Investment Services industry. Its latest annual revenue is $117.10B, ranking 2 in the industry. The net profit is $16.30B, ranking 1 in the industry. Company Profile
Over the past month, multiple analysts have rated the company as Hold, with an average price target of $1174.89, a high of $1325.00, and a low of $995.00.
More details about Goldman Sachs Group Inc (GS)
Company Specific Risks:
- Sensitivity to Investment Banking Fee Contraction: Cautionary commentary from bank industry leadership warning of flat third-quarter trading revenues and declining investment banking advisory fees triggered a sharp drop in Goldman Sachs stock. Because Goldman remains far more dependent on institutional trading, debt/equity underwriting, and M&A advisory fees than universal banks backed by consumer deposit buffers, an industry-wide slowdown in dealmaking disproportionately impairs near-term earnings power.
- Analyst Downgrades and Elevated Valuation Risk: Recent Wall Street downgrades from "Buy" to "Hold" highlight growing analyst concern that Goldman's shares are trading at a premium relative to fair value and historical book-value multiples. Institutional investors are emphasizing thin margins of safety and persistent insider selling over the past year, increasing stock vulnerability to downside volatility if near-term financial results miss consensus estimates.
- Regulatory Exposure in AI Trading and Client Due Diligence: Emerging regulatory inquiries regarding complex AI-driven trading strategies and institutional client due diligence processes pose legal and reputational risks. Heightened regulatory oversight could restrict institutional trading strategies, increase legal compliance overhead, and disrupt high-margin capital markets operations.
- Hawkish Policy Reversal and Macro Dealmaking Drag: A hawkish shift in Federal Reserve policy expectations, driven by lingering inflationary pressures and rising energy costs, threatens to keep benchmark interest rates elevated. Sustained high borrowing costs curb corporate appetite for debt underwriting, equity offerings, and leveraged buyouts, directly dampening Goldman's core investment banking advisory pipeline.
This article may include AI-generated content that is human-reviewed, which is for reference and general information purposes only and does not constitute investment advice.
Recommended Articles









Comments (0)
Click the $ button, enter the symbol, and select to link a stock, ETF, or other ticker.