


Netflix Inc Stock (NFLX) Moved Down by 3.10% on Sep 15: Drivers Behind the Movement



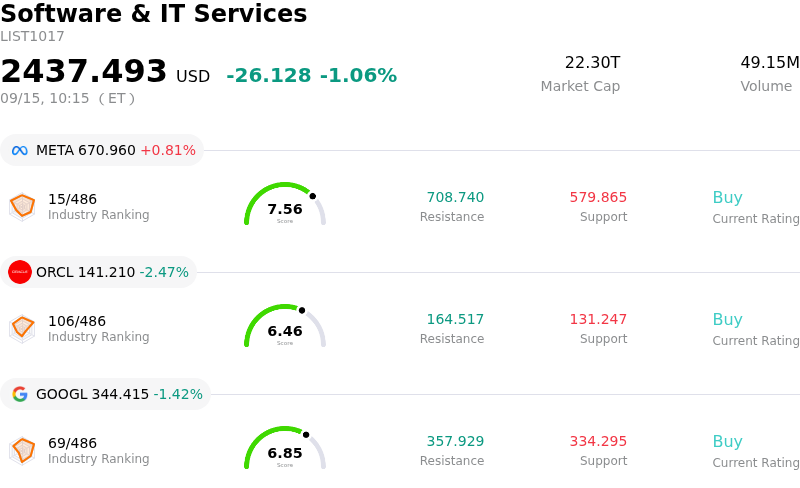
Netflix Inc (NFLX) moved down by 3.10%. The Software & IT Services sector is down by 1.06%. The company underperformed the industry. Top 3 stocks by turnover in the sector: Meta Platforms Inc (META) up 0.45%; Oracle Corp (ORCL) down 2.47%; Alphabet Inc Class A (GOOGL) down 1.42%.
What is driving Netflix Inc (NFLX)’s stock price down today?
Netflix experienced downward price action alongside notable intraday volatility as investors engaged in profit-taking following a sharp rally in the previous trading session. The stock had surged after optimistic Wall Street research highlighted growth catalysts in live sports programming, short-form content initiatives, and ad-tier momentum across key international markets. However, with technical momentum indicators approaching overbought territory near established chart resistance, short-term market participants moved to lock in gains, triggering a moderate pullback.
Adding to the cautious tone, recent institutional disclosures revealed position adjustments by prominent fund managers, alongside routine insider share sales executed under pre-arranged trading plans. While these disclosures often reflect portfolio rebalancing or personal financial planning rather than fundamental operational weakness, they generated temporary overhead supply pressure. Concurrently, headline noise regarding ongoing legal developments related to user data practices contributed to temporary investor hesitation.
Looking ahead, market participants remain focused on the upcoming third-quarter earnings report as the next primary fundamental catalyst. Institutional consensus continues to monitor advertising revenue scaling, operating margin resilience above long-term guidance, and free cash flow generation against elevated valuation expectations. Until official quarterly results confirm subscriber engagement and advertising tier traction, near-term price movement is expected to remain bound by technical consolidation and market-wide risk management.
Technical Analysis of Netflix Inc (NFLX)
Technically, Netflix Inc (NFLX) shows a MACD (12,26,9) value of -0.947, indicating a neutral signal. The RSI at 49.090 suggests neutral condition and the Williams %R at 67.270 suggests sell condition. Please monitor closely.
Media Coverage of Netflix Inc (NFLX)
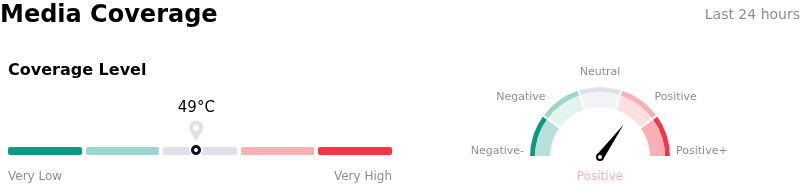
In terms of media coverage, Netflix Inc (NFLX) shows a coverage score of 49, indicating a moderate level of media attention. The overall market sentiment index is currently in bullish zone.
Fundamental Analysis of Netflix Inc (NFLX)
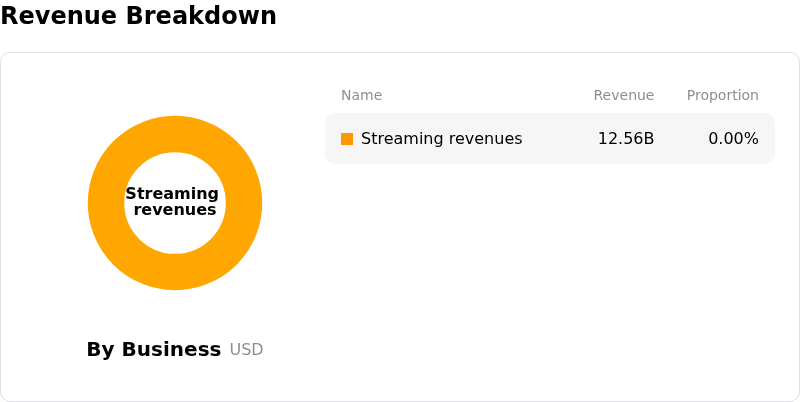
Netflix Inc (NFLX) is in the Software & IT Services industry. Its latest annual revenue is $45.18B, ranking 12 in the industry. The net profit is $10.98B, ranking 10 in the industry. Company Profile
Over the past month, multiple analysts have rated the company as Buy, with an average price target of $95.55, a high of $135.00, and a low of $70.00.
More details about Netflix Inc (NFLX)
Company Specific Risks:
- Decelerating Viewership and Engagement Metrics: Recent market analysis points to flatlining total viewing time and decelerating engagement across core film and television content, raising concern that subscription expansion is stalling in primary markets.
- Escalating Capital Demands for Content and Live Sports: Expanded commitments to live sports broadcasting rights and live programming alliances impose high capital outlay requirements, which threaten to compress near-term operating margins if ad-tier monetization fails to scale proportionally.
- Sustained Insider Divestment and Profit-Taking: Significant insider selling exceeding 200,000 shares in recent months, paired with sharp profit-taking following brief price rebounds, continues to cap near-term stock momentum and signal executive caution.
- Subscription Price Sensitivity and Churn Vulnerability: Heavy reliance on regional price increases and lower-ARPU ad-supported tiers to drive top-line growth leaves the company vulnerable to churn, particularly amidst heightened competition from rival streaming coalitions.
This article may include AI-generated content that is human-reviewed, which is for reference and general information purposes only and does not constitute investment advice.
Recommended Articles









Comments (0)
Click the $ button, enter the symbol, and select to link a stock, ETF, or other ticker.