


Ethereum (ETHUSD) Suddenly Goes down 2.23% on Sep 15: What You Need to Watch



Ethereum (ETHUSD) is down 2.23% at Sep 15 20:05(ET), now at $2510.93, with a 7-day up of 1.22%.
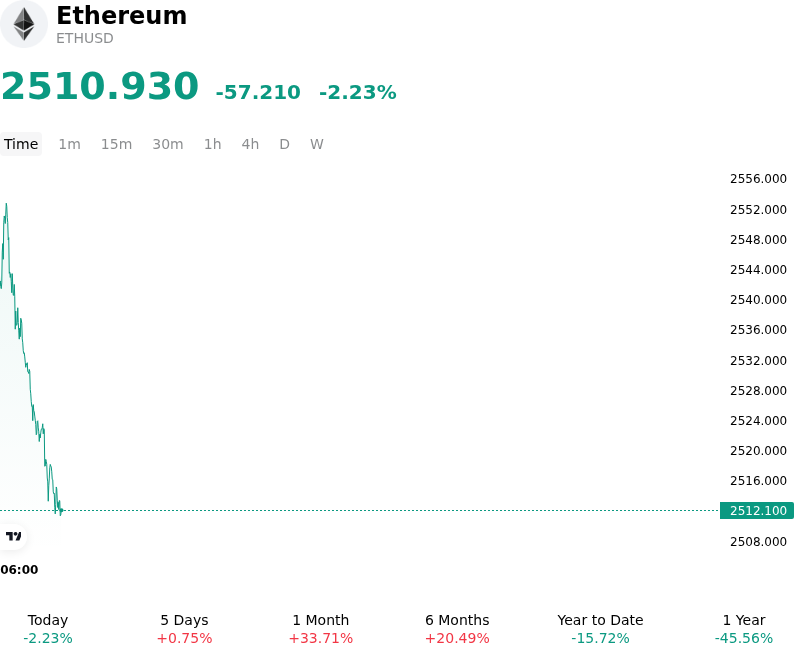
What is driving Ethereum (ETHUSD)’s stock price down today?
Ethereum experienced downward price pressure as institutional investors reduced risk exposure heading into the Federal Reserve's monetary policy decision. With the Federal Open Market Committee commencing its September meeting, heightened interest rate expectations and persistent inflation concerns drove U.S. Treasury yields higher and strengthened the U.S. dollar. This macroeconomic tightening reduced broader market liquidity and weighed on risk appetite, leading market participants to scale back allocations across high-beta digital assets.
Institutional capital flows reflected this cautious positioning. Momentum in spot Ether exchange-traded funds moderated as select products recorded net outflows and profit-taking following recent price gains. The pause in institutional spot demand diminished buy-side depth, leaving the asset vulnerable to market order imbalances during peak liquidity windows.
Derivatives positioning further amplified the decline. Long positions that had accumulated during prior sessions faced liquidations as price action broke below key technical support levels. The reduction in open interest and unwinding of leveraged exposure created secondary selling pressure, accelerating intraday downward momentum. On-chain activity showed a temporary deceleration in decentralized finance activity and staking inflows, confirming a broader wait-and-see stance across institutional desks.
The move primarily reflects an event-driven macroeconomic repricing ahead of central bank policy clarity rather than a structural deterioration in network fundamentals. However, market participants continue to monitor risks surrounding elevated real yields, sustained strength in the U.S. dollar, and potential shifts in institutional fund flows. Near-term price action remains tied to global liquidity conditions and derivatives positioning until macroeconomic guidance stabilizes.
Technical Analysis of Ethereum (ETHUSD)
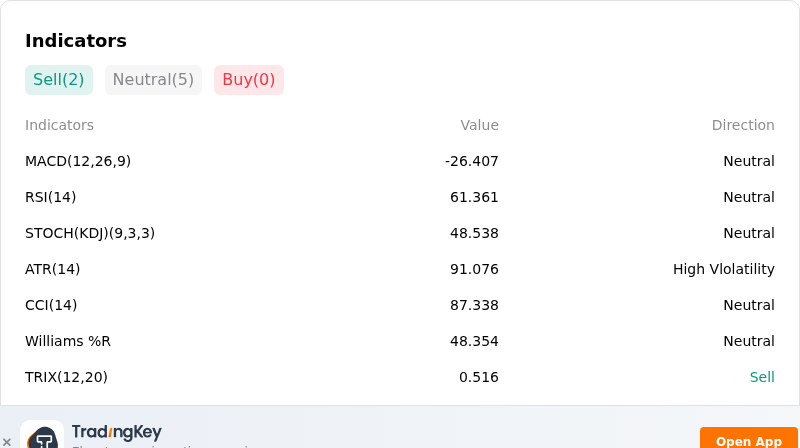
Technically, Ethereum (ETHUSD) shows a MACD (12,26,9) value of -26.407, indicating a neutral signal. The RSI at 61.361 suggests neutral condition and the Williams %R at 48.354 suggests neutral condition. Please monitor closely.
More details about Ethereum (ETHUSD)
Recent Events and Risks:
- Spot ETF Outflows and De-Risking: U.S. spot Ethereum ETFs experienced net daily redemptions alongside a sharp deceleration in institutional inflows ahead of central bank monetary policy decisions, reducing spot market liquidity absorption.
- Derivatives Leverage and Liquidation Exposure: Derivatives heatmap metrics indicate heavy long-side leverage clustered directly below immediate technical support around $2,400, exposing over $1 billion in long positions to cascading forced liquidations if prices breach key levels.
- Whale Inflows to Exchanges and Options Skew: Recent on-chain tracking reveals substantial whale wallet transfers onto centralized exchange order books alongside defensive options positioning clustered around lower downside strikes near $2,250, heightening secondary spot market selling pressure.
- Regulatory Uncertainty and Policy Headwinds: Market sentiment is constrained by upcoming legislative reviews of digital asset tax proposals and administrative delays surrounding crypto market structure bills, sustaining policy headwinds across major crypto assets.
This article may include AI-generated content that is human-reviewed, which is for reference and general information purposes only and does not constitute investment advice.
Recommended Articles











Comments (0)
Click the $ button, enter the symbol, and select to link a stock, ETF, or other ticker.