


Bitcoin (BTCUSD) Suddenly Goes down 1.00% on Sep 4: What You Need to Watch



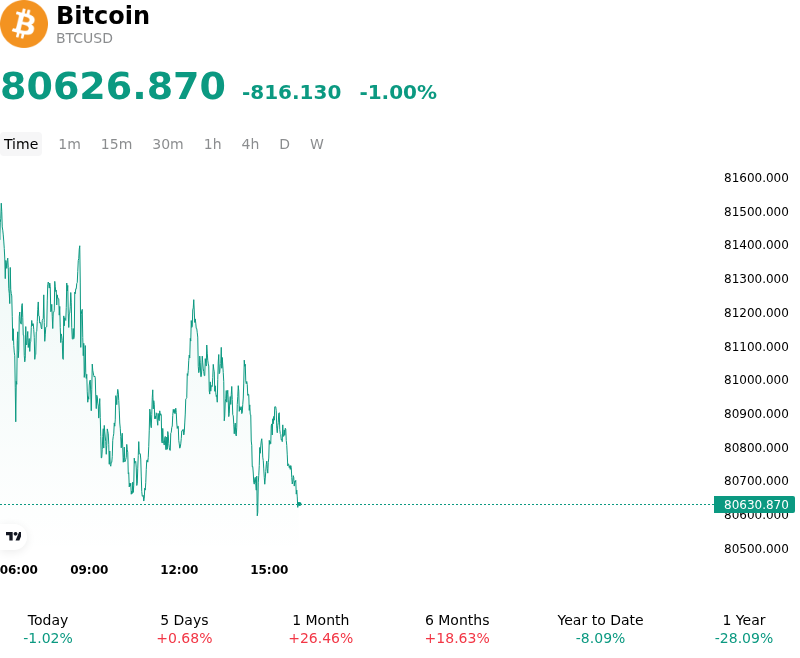
Bitcoin (BTCUSD) is down 1.00% at Sep 4 04:00(ET), now at $80626.87, with a 7-day up of 4.20%.
What is driving Bitcoin (BTCUSD)’s stock price down today?
The pullback in Bitcoin reflects intraday profit-taking and positional rebalancing following a sharp multi-day advance toward psychological overhead resistance near the $82,000 threshold. After advancing on short-covering dynamics and dovish signals from Federal Reserve officials regarding potential interest rate stabilization, buying momentum stalled as market participants moved to lock in short-term gains. Capital flows temporarily cooled ahead of incoming U.S. labor market indicators and upcoming central bank policy decisions, prompting tactical traders to trim spot exposure and moderate their risk profile.
From a market structure perspective, the retreat was largely driven by a leverage reset following heavy derivative liquidations in prior sessions. Momentum indicators had pushed into short-term overbought territory, leaving order books vulnerable to seller absorption at resistance levels. While institutional demand via spot Bitcoin exchange-traded funds has offered underlying structural support, options and prediction market positioning show that institutional desks remain cautious about bidding for an immediate record-setting breakout. Consequently, market participants favored hedging against near-term downside volatility over chasing extended upside valuations.
Despite the intraday decline, the broader macroeconomic backdrop continues to be shaped by shifting monetary policy expectations, global yield movements, and steady institutional integration. Lower Treasury yields and dollar fluctuations maintain a generally supportive liquidity narrative for digital assets, but sticky inflation risks and macroeconomic uncertainties keep investors watchful. Near-term market direction will depend on whether spot liquidity can consolidate above key technical support boundaries or if further de-risking will push prices toward lower demand zones.
Technical Analysis of Bitcoin (BTCUSD)
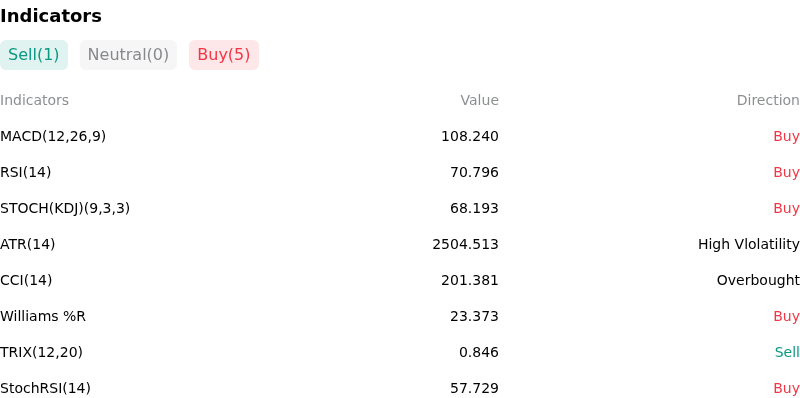
Technically, Bitcoin (BTCUSD) shows a MACD (12,26,9) value of 108.240, indicating a buy signal. The RSI at 70.796 suggests buy condition and the Williams %R at 23.373 suggests buy condition. Please monitor closely.
More details about Bitcoin (BTCUSD)
Recent Events and Risks:
- Macro Hawkishness and Geopolitical Friction: Surging U.S. 10-year Treasury yields alongside rising market probabilities of a Federal Reserve rate hike at the upcoming September FOMC meeting have strengthened risk-off sentiment, placing persistent macro downward pressure on Bitcoin.
- On-Chain Demand Contraction and Rising Exchange Balances: On-chain tracking shows 30-day apparent Bitcoin demand sliding into deep negative territory (-80,000 BTC) while Binance exchange balances climbed to 2026 highs near 687,000 BTC, indicating rising liquid supply available for sale against weakening spot buyer absorption.
- Leverage Overextension and Liquidation Vulnerability: Futures positioning remains long-skewed with positive funding rates despite price consolidation below the key $80,000 resistance level, heightening downside risk toward key support zones between $76,000 and $71,000 if long positions unwind.
- Spot ETF Flow Volatility: U.S. spot Bitcoin ETFs have experienced sharp flow reversals, exemplified by large single-day net outflows led by major issuers like BlackRock's IBIT, highlighting institutional hesitation and capital rotation into defensive assets during periods of price stalls.
This article may include AI-generated content that is human-reviewed, which is for reference and general information purposes only and does not constitute investment advice.
Recommended Articles









Comments (0)
Click the $ button, enter the symbol, and select to link a stock, ETF, or other ticker.