


Newmont Corporation Stock (NEM) Moved Up by 3.58% on Sep 3: Facts Behind the Movement



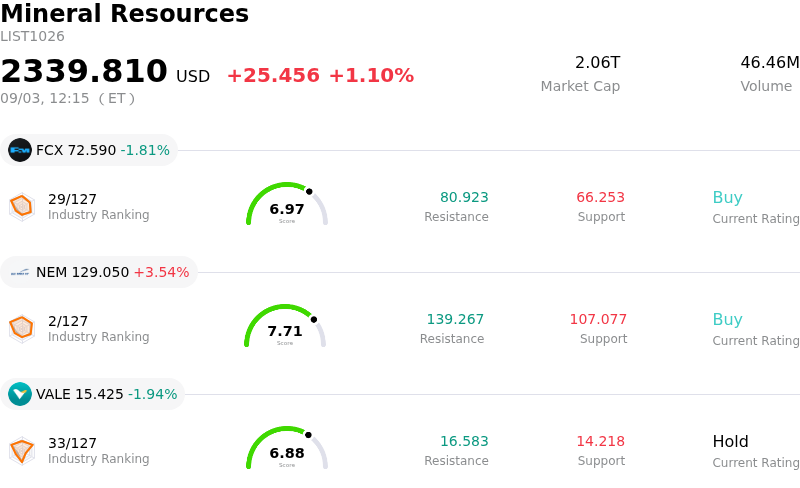
Newmont Corporation (NEM) moved up by 3.58%. The Mineral Resources sector is up by 1.10%. The company outperformed the industry. Top 3 stocks by turnover in the sector: Freeport-McMoRan Inc (FCX) down 1.81%; Newmont Corporation (NEM) up 3.54%; Vale SA (VALE) down 1.94%.
What is driving Newmont Corporation (NEM)’s stock price up today?
Newmont Corporation experienced strong upward price momentum during the trading session, primarily driven by a sharp rally in spot gold prices. Macroeconomic developments provided a major tailwind for precious metals as U.S. Treasury yields retreated and the U.S. dollar weakened. Softer labor market indicators and comments from Federal Reserve officials signaling a potential pause in interest rate hikes eased market concerns over monetary tightening. Because lower real yields reduce the opportunity cost of holding non-interest-bearing bullion, safe-haven and inflation-hedge demand elevated gold prices toward near-record levels. As the world's largest gold producer, Newmont maintains substantial operational leverage to underlying commodity prices, allowing increases in spot gold to translate into strong top-line and margin expectations for the company.
Beyond macro tailwinds, company-specific catalysts continue to support investor confidence. The recent resolution of the administrative dispute with Barrick Mining Corporation regarding the Nevada Gold Mines joint venture eliminated a strategic overhang. The settlement de-risks Newmont's asset portfolio while unlocking key operational synergies across its core production footprint. Furthermore, Newmont's fundamental position remains supported by solid operational execution, highlighted by recent quarterly earnings that exceeded analyst expectations and reaffirmed full-year production targets. The company's ongoing capital allocation framework, including its routine quarterly dividend payments and share repurchases, reinforces its financial stability and cash-generation capabilities.
Market sentiment was further bolstered by institutional positioning and analyst backing. Recent quarterly regulatory filings revealed new and expanded stakes from institutional investors, signaling sustained confidence from smart-money market participants despite broader volatility across basic materials. Analysts maintain a predominantly positive stance on the equity, citing strong cash flows, disciplined balance sheet management, and a low debt-to-equity profile. Although short-term fluctuations may occur alongside broader commodity cycles and upcoming macroeconomic releases, the combination of rising bullion prices, cleared corporate uncertainties, and solid institutional backing created a highly favorable environment for Newmont's equity movement.
Technical Analysis of Newmont Corporation (NEM)
Technically, Newmont Corporation (NEM) shows a MACD (12,26,9) value of -1.672, indicating a neutral signal. The RSI at 63.121 suggests neutral condition and the Williams %R at 30.479 suggests buy condition. Please monitor closely.
Media Coverage of Newmont Corporation (NEM)
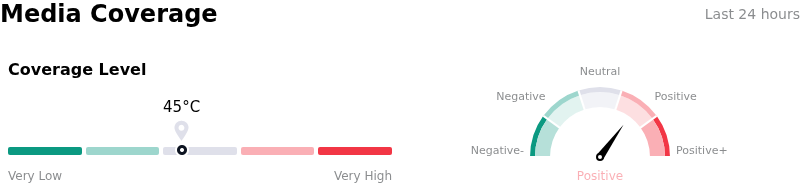
In terms of media coverage, Newmont Corporation (NEM) shows a coverage score of 45, indicating a moderate level of media attention. The overall market sentiment index is currently in bullish zone.
Fundamental Analysis of Newmont Corporation (NEM)
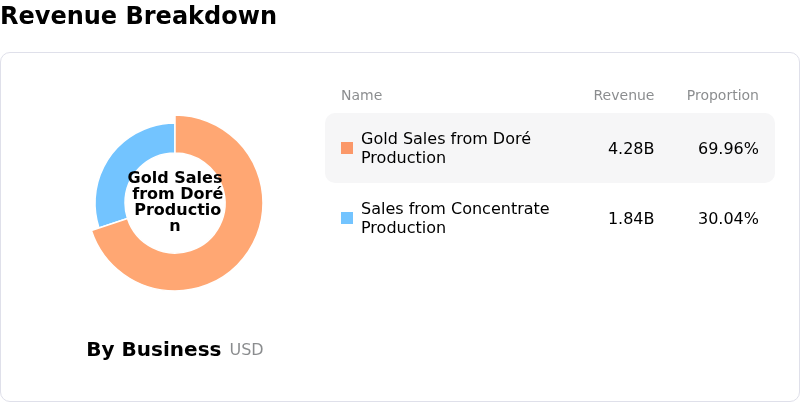
Newmont Corporation (NEM) is in the Mineral Resources industry. Its latest annual revenue is $22.67B, ranking 10 in the industry. The net profit is $7.08B, ranking 3 in the industry. Company Profile
Over the past month, multiple analysts have rated the company as Buy, with an average price target of $133.58, a high of $205.00, and a low of $64.32.
More details about Newmont Corporation (NEM)
Company Specific Risks:
- Top-Line Revenue Miss and Margin Compression: Newmont's recent quarterly performance revealed operational vulnerabilities after reporting $6.12 billion in revenue, missing the $6.35 billion Wall Street consensus estimate, while sequentially declining operating margins highlight rising all-in sustaining costs despite elevated realized gold prices.
- Insider Share Divestments via Form 144 Filings: SEC Form 144 filings on September 1 disclosed planned insider share sales by Chief Executive Officer Natascha Viljoen and Executive Vice President Peter Toth, compounding market caution following $11.9 million in net insider selling over the past 12 months with zero insider purchases.
- Capital Outflows from Nevada Joint Venture Restructuring: The finalized restructuring agreement with Barrick Mining Corporation regarding the Nevada Gold Mines complex requires a $1.95 billion cash settlement from Newmont along with heavy ongoing capital commitments, placing friction on near-term free cash flow generation.
- Ex-Dividend Technical Pressure and Extended Valuation: Reaching its ex-dividend date on September 3 for a $0.26 per share quarterly payout creates technical price adjustments, increasing downside volatility as trading multiples hover significantly above fundamental intrinsic valuation estimates.
This article may include AI-generated content that is human-reviewed, which is for reference and general information purposes only and does not constitute investment advice.
Recommended Articles








Comments (0)
Click the $ button, enter the symbol, and select to link a stock, ETF, or other ticker.