


Newmont Corporation Stock (NEM) Moved Up by 3.33% on Sep 2: What Investors Need To Know



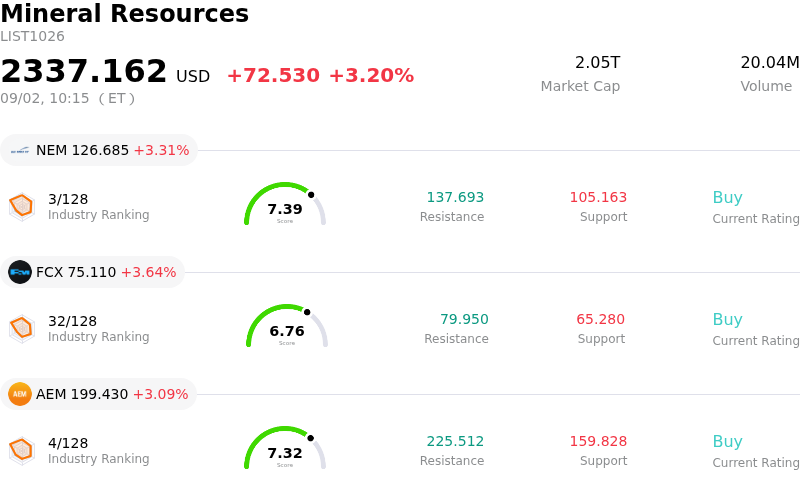
Newmont Corporation (NEM) moved up by 3.33%. The Mineral Resources sector is up by 3.20%. The company outperformed the industry. Top 3 stocks by turnover in the sector: Newmont Corporation (NEM) up 3.31%; Freeport-McMoRan Inc (FCX) up 3.64%; Agnico Eagle Mines Ltd (AEM) up 3.09%.
What is driving Newmont Corporation (NEM)’s stock price up today?
Newmont Corporation experienced positive momentum driven primarily by stabilizing spot gold prices and shifting macroeconomic expectations. Following recent pressure on precious metals, signs of softening economic data, including lower-than-expected private employment figures, prompted market participants to recalibrate their forecasts regarding Federal Reserve monetary policy. The resulting easing in rate-hike expectations provided a favorable backdrop for non-yielding assets, sparking renewed demand across the gold mining space. As the world's largest gold producer, Newmont’s equity value remains tightly correlated with underlying bullion dynamics, allowing it to capture strong operational leverage during commodity rebounds.
Underlying the macroeconomic relief is solid corporate support anchored by Newmont's robust balance sheet and disciplined capital allocation framework. Investors continue to digest recent operational execution from strong quarterly earnings and the integration of high-margin assets. The addition of experienced industry leadership to the board of directors, combined with an expanded multi-billion-dollar share repurchase authorization and regular quarterly dividend distributions, reinforces long-term institutional confidence. This focus on capital discipline and shareholder returns helps cushion against short-term commodity swings and supports baseline valuation multiples.
Despite the upward trajectory, the stock exhibited heightened intraday volatility as traders navigated competing catalysts. Fluctuations in broader equity indices, currency movements, and tactical positioning ahead of upcoming economic releases contributed to two-way price action throughout the session. While short-term swings remain tied to immediate shifts in interest rate expectations and spot metals pricing, institutional focus remains centered on Newmont's production stability, cost control efforts, and long-term cash flow generation capabilities.
Technical Analysis of Newmont Corporation (NEM)
Technically, Newmont Corporation (NEM) shows a MACD (12,26,9) value of -1.582, indicating a neutral signal. The RSI at 60.500 suggests neutral condition and the Williams %R at 43.079 suggests buy condition. Please monitor closely.
Media Coverage of Newmont Corporation (NEM)
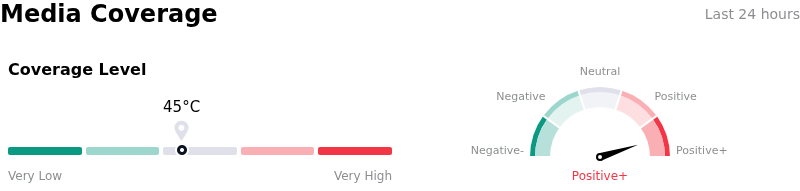
In terms of media coverage, Newmont Corporation (NEM) shows a coverage score of 45, indicating a moderate level of media attention. The overall market sentiment index is currently in extremely bullish zone.
Fundamental Analysis of Newmont Corporation (NEM)
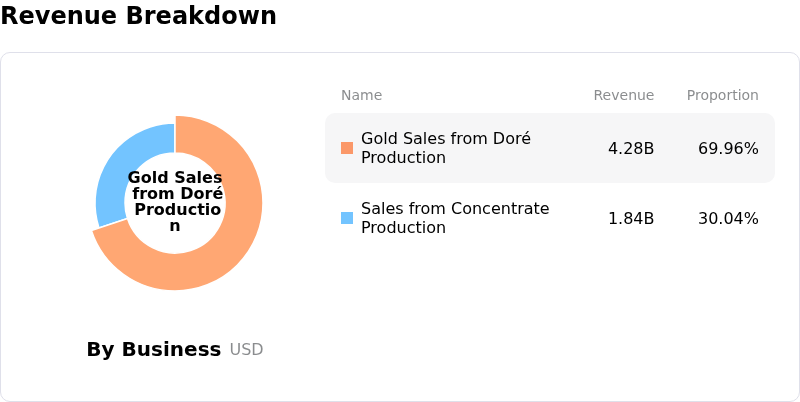
Newmont Corporation (NEM) is in the Mineral Resources industry. Its latest annual revenue is $22.67B, ranking 8 in the industry. The net profit is $7.08B, ranking 3 in the industry. Company Profile
Over the past month, multiple analysts have rated the company as Buy, with an average price target of $133.58, a high of $205.00, and a low of $64.32.
More details about Newmont Corporation (NEM)
Company Specific Risks:
- Quarterly Revenue Shortfall: Newmont reported quarterly revenues of $6.12 billion, missing Wall Street consensus estimates of $6.35 billion, demonstrating top-line execution vulnerability even amid elevated realized gold prices.
- Capital Outflows and Nevada JV Restructuring: The finalized settlement with Barrick Mining Corporation to reshape the shared Nevada Gold Mines complex involves cash settlement outflows and heavy capital expenditure commitments, placing friction on near-term free cash flow generation.
- Institutional Valuation Downgrades and Target Cuts: Research analysts at major firms including Bank of America and Barclays have reduced price targets while downgrades to Hold highlight that the stock trades above intrinsic value estimates, compressing the margin of safety.
- Executive Insider Share Disposals: SEC Form 144 filings disclosed planned insider share liquidations by chief executive leadership, including CEO Natascha Viljoen and senior executive Peter Toth, increasing market selling pressure and governance overhang.
This article may include AI-generated content that is human-reviewed, which is for reference and general information purposes only and does not constitute investment advice.
Recommended Articles








Comments (0)
Click the $ button, enter the symbol, and select to link a stock, ETF, or other ticker.