


Ethereum (ETHUSD) Is down 1.09% on Sep 1: What Are the Risk Factors?



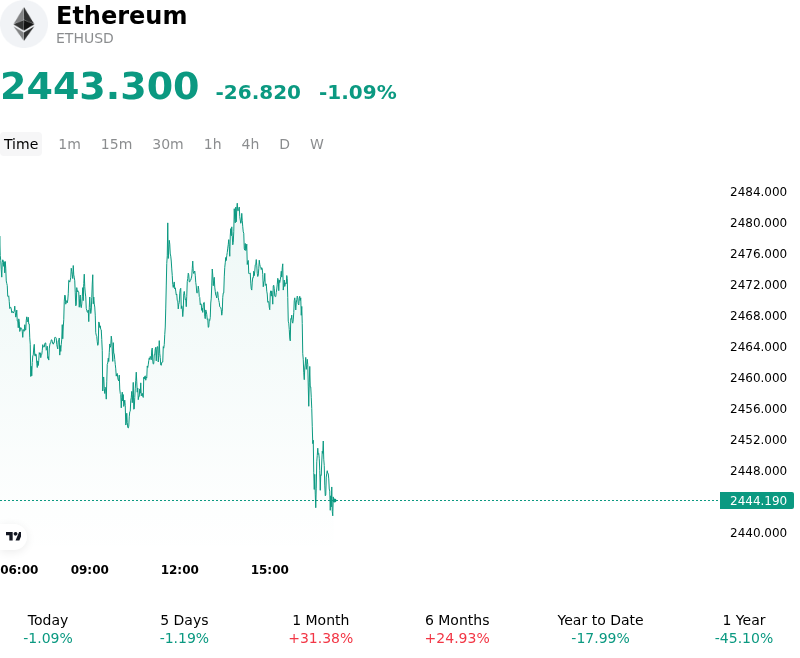
Ethereum (ETHUSD) is down 1.09% at Sep 1 05:10(ET), now at $2443.3, with a 7-day up of 0.38%.
What is driving Ethereum (ETHUSD)’s stock price down today?
Ethereum experienced downward price action as market participants took profits following an unsuccessful attempt to breach overhead technical resistance near key psychological levels. After a sustained run-up during late August, the rejection at overhead resistance triggered short-term position unwinding, further amplified by notable on-chain exchange inflows. Large wallet transfers to centralized trading venues increased spot market liquidity on order books, leading short-term traders to anticipate potential selling pressure and reduce leverage accordingly.
Macroeconomic conditions also weighed on risk appetite across digital asset markets. U.S. Treasury yields stabilized while institutional investors reassessed the anticipated trajectory of Federal Reserve interest rate policy ahead of upcoming policy decisions. A modest firming in rate expectations and dollar strength incentivized macro-oriented funds to temporarily trim risk exposure, suppressing net capital inflows into Ethereum spot instruments and decentralized finance protocols.
Within derivatives markets, elevated open interest among leveraged long positions exacerbated the downward drift as localized long liquidations ensued. Despite the temporary pullback, broader structural indicators, including underlying staking activity and spot ETF flow stability, suggest that institutional interest remains intact over longer time horizons. Market participants continue to monitor macro liquidity trends and ecosystem activity to determine whether current price action represents healthy consolidation following recent gains or a broader shift toward risk mitigation.
Technical Analysis of Ethereum (ETHUSD)
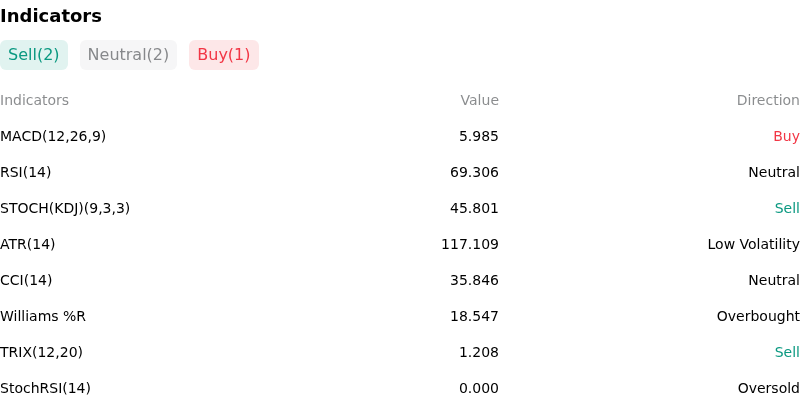
Technically, Ethereum (ETHUSD) shows a MACD (12,26,9) value of 5.985, indicating a buy signal. The RSI at 69.306 suggests neutral condition and the Williams %R at 18.547 suggests overbought condition. Please monitor closely.
More details about Ethereum (ETHUSD)
Recent Events and Risks:
- Leveraged Futures Overcrowding and Liquidation Risk: High perpetual futures open interest combined with elevated funding rates has left crowded long positions vulnerable to sharp downside moves. A breakdown below key short-term technical support near $2,397 threatens to trigger a cascade of long liquidations toward the $2,300 zone.
- Institutional Spot ETF Outflows and Stalled Momentum: Capital accumulation across U.S. spot Ethereum ETFs has slowed markedly, with intermittent net daily redemptions replacing earlier strong inflows. This loss of institutional buying velocity reduces spot market bid depth needed to absorb overhead profit-taking.
- Macroeconomic Headwinds and Rising Treasury Yields: Hawkish commentary from Federal Reserve leadership emphasizing persistent inflation risks has pushed U.S. Treasury yields higher and bolstered the U.S. Dollar. This broader macroeconomic tightening is triggering risk-off sentiment and driving institutional de-risking in high-beta crypto assets.
- Cross-Chain DeFi Exploits and Security Vulnerabilities: Recent security incidents within interconnected decentralized finance and bridge protocols—such as the $74 million TectonicFi exploit where attacker funds were bridged directly to Ethereum—have heightened smart contract vulnerability fears and dampened short-term sentiment across the Ethereum ecosystem.
This article may include AI-generated content that is human-reviewed, which is for reference and general information purposes only and does not constitute investment advice.
Recommended Articles








Comments (0)
Click the $ button, enter the symbol, and select to link a stock, ETF, or other ticker.