


Equinor ASA Stock (EQNR) Moved Up by 3.14% on Aug 31: What Signal Does It Send?



Equinor ASA (EQNR) moved up by 3.14%. The Energy - Fossil Fuels sector is up by 1.82%. The company outperformed the industry. Top 3 stocks by turnover in the sector: Schlumberger NV (SLB) up 3.87%; Exxon Mobil Corp (XOM) up 2.29%; Chevron Corp (CVX) up 2.30%.
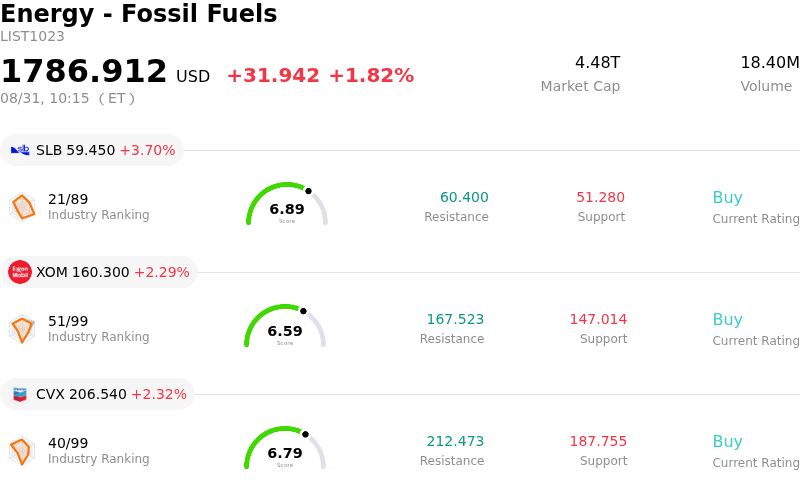
What is driving Equinor ASA (EQNR)’s stock price up today?
The upward movement in Equinor ASA's share price reflects strong tailwinds across global energy markets, highlighted by a sharp rally in European natural gas benchmark prices and rising international crude oil benchmarks. Persistent geopolitical tensions in key producing regions have elevated energy security concerns, while European natural gas storage levels sit significantly below historical averages heading into the autumn and winter heating seasons. As Europe's primary supplier of pipeline natural gas, Equinor stands as a direct beneficiary of elevated natural gas benchmark prices in Europe, boosting revenue expectations for its core upstream production segment.
Equinor's performance was further supported by positive corporate milestones and strategic long-term supply agreements. The company recently finalized a major fifteen-year gas supply contract with Germany's Uniper to deliver substantial annual natural gas volumes, solidifying its role as Europe's principal energy partner. Additionally, operational achievements such as bringing additional subsea gas production online at the Troll field bolster immediate output capacity. Outside traditional hydrocarbon operations, Equinor's joint venture secured a ten-year binding lithium offtake agreement with LG Energy Solution, highlighting progress in energy transition initiatives and long-term asset diversification.
Ongoing capital return programs and disciplined balance sheet execution continue to underpin institutional support. Active execution of the company's share buyback program, alongside steady quarterly cash dividend distributions, provides valuation support and enhances shareholder return during periods of broader market volatility. Although broader macroeconomic factors, such as central bank interest rate trajectories and European growth outlooks, introduce intraday volatility, the fundamental alignment of rising commodity prices, expansion of long-term supply commitments, and robust capital returns continues to drive positive market sentiment.
Technical Analysis of Equinor ASA (EQNR)
Technically, Equinor ASA (EQNR) shows a MACD (12,26,9) value of -0.250, indicating a neutral signal. The RSI at 63.800 suggests neutral condition and the Williams %R at 12.329 suggests overbought condition. Please monitor closely.
Fundamental Analysis of Equinor ASA (EQNR)
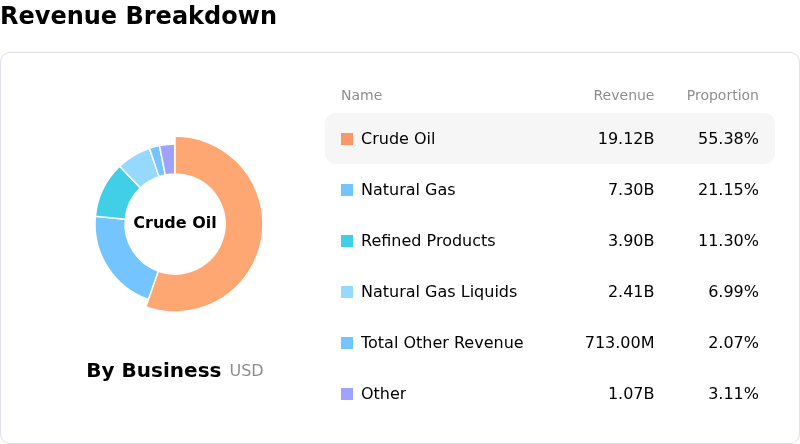
Equinor ASA (EQNR) is in the Energy - Fossil Fuels industry. Its latest annual revenue is $105.83B, ranking 9 in the industry. The net profit is $5.04B, ranking 9 in the industry. Company Profile
Over the past month, multiple analysts have rated the company as Hold, with an average price target of $35.89, a high of $39.88, and a low of $31.25.
More details about Equinor ASA (EQNR)
Company Specific Risks:
- Wall Street Downgrades and Valuation Overhang: SB1 Markets downgraded Equinor to a Sell rating with a 365 NOK price target, cautioning that the equity's recent run-up already prices in one to two years of elevated earnings, leaving the stock vulnerable to sharp profit-taking.
- Earnings Estimates Trimmed Post-Q2 Miss: Erste Group Bank lowered its FY2026 EPS estimates to $5.09 following Equinor's second-quarter earnings miss ($1.33 vs. $1.39 consensus), highlighting lingering margin compression and ongoing operational cost headwinds.
- Spot Commodity Volatility and Price Realization Risk: High sensitivity to European natural gas benchmarks (such as TTF and NBP) and broader pullbacks in crude oil prices expose revenue streams to downside volatility as softening global demand forecasts trim realized pricing power.
- Renewable Restructuring and Offshore Wind Capital Drag: Following the official abandonment of its 2030 renewable capacity targets and exits from high-cost offshore wind markets such as Japan, project cost inflation and capital reallocation friction continue to generate strategic risk.
This article may include AI-generated content that is human-reviewed, which is for reference and general information purposes only and does not constitute investment advice.
Recommended Articles










Comments (0)
Click the $ button, enter the symbol, and select to link a stock, ETF, or other ticker.