


Solana (SOLUSD) Is up 1.09% on Aug 29: Why It Happened



Solana (SOLUSD) is up 1.09% at Aug 29 10:45(ET), now at $103.98, with a 7-day up of 11.34%.
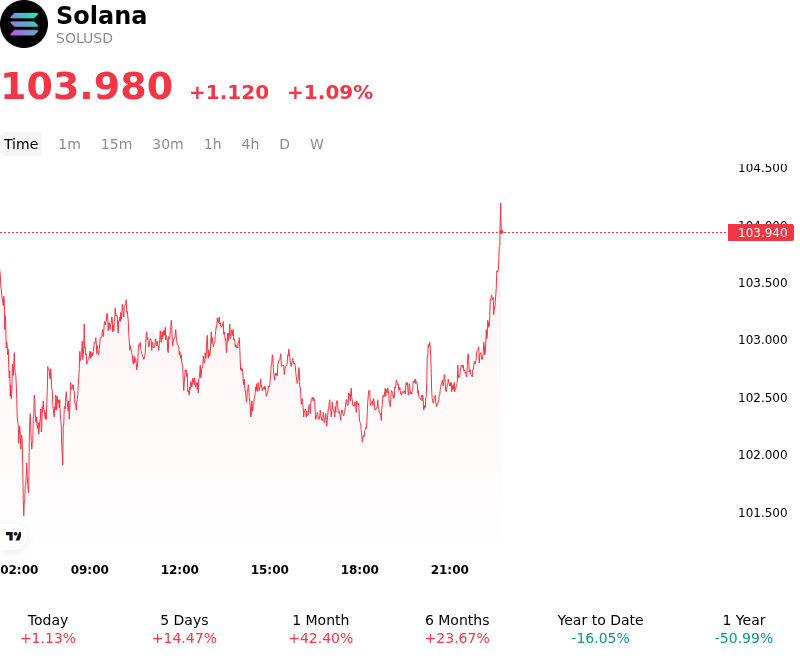
What is driving Solana (SOLUSD)’s stock price up today?
Capital flowed into Solana as market participants responded to a landmark governance outcome that fundamentally tightened the protocol's long-term issuance schedule. The successful passage of the SGP-0002 disinflation proposal accelerated Solana's annual issuance reduction from 15% to 30%, cutting the timeline to reach its 1.5% terminal inflation floor by nearly half. By curtailing projected token issuance by approximately 18.9 million SOL over six years, the network significantly reduced long-term holder dilution. Institutional allocators interpreted this structural shift toward token scarcity as a key catalyst, prompting a repricing of the asset as supply-side pressure diminishes over subsequent market cycles.
Sustained institutional demand through spot Solana exchange-traded funds provided a strong liquidity backdrop for the move. Cumulative inflows into spot products continued to reach record levels, with institutional vehicles capturing steady net capital allocations. This institutional tailwind coincided with robust ecosystem metrics, including elevated transaction throughput and growing volume in tokenized real-world assets. The confluence of institutional product accumulation and organic network usage reinforced confidence that demand for Solana blockspace remains resilient, supporting higher fundamental valuation floors.
Derivatives market positioning further amplified the upward momentum as spot accumulation pushed prices above critical psychological resistance levels. The technical breakout encouraged systematic traders to unwind short hedges while attracting fresh leveraged long interest in perpetual futures. Looking ahead, institutional investors are weighing the positive supply contraction against potential secondary effects, such as lower nominal staking yields for network validators and broader macroeconomic liquidity conditions. While short-term volatility remains dependent on overall digital asset risk appetite, the structural tightening of tokenomics alongside expanding institutional access significantly improves Solana's long-term market positioning.
Technical Analysis of Solana (SOLUSD)
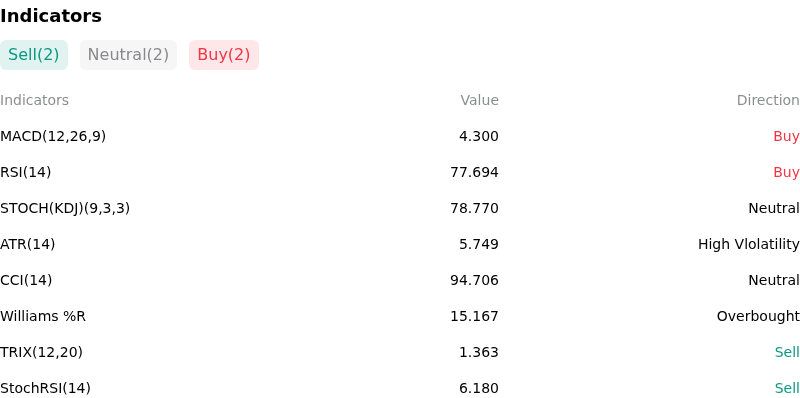
Technically, Solana (SOLUSD) shows a MACD (12,26,9) value of 4.300, indicating a buy signal. The RSI at 77.694 suggests buy condition and the Williams %R at 15.167 suggests overbought condition. Please monitor closely.
More details about Solana (SOLUSD)
Recent Events and Risks:
- Overbought Resistance Rejection and Liquidation Risk: Following a rapid multi-week rally to multi-month highs near $102.88–$109, SOL experienced sharp intraday rejections that triggered over $17.5 million in long position liquidations. With the daily Relative Strength Index (RSI) pushing into overbought territory above 79, market participants face heightened downside risks of leveraged long unwinds if key immediate support around $93.75–$95 fails to hold.
- Historical ETF Flow Reversal Signal: Although spot Solana ETFs recently recorded single-day net inflows exceeding $60 million, institutional analysts highlight that previous daily inflow spikes were historically followed by sharp price contractions. This historical precedent creates sell-the-news distribution risks among large holders while price action stalls below psychological resistance.
- Post-Governance Catalyst Exhaustion: Solana completed its first formal on-chain governance vote regarding network protocol changes, which drove a surge in speculative buying. However, traders express concern that because approved structural and issuance updates will take months to physically impact circulating supply, the immediate narrative catalyst is spent, leaving SOL vulnerable to fundamental pullbacks.
- Derivatives Over-Leverage and Technical Exposure: Elevated open interest across perpetual swap markets leaves SOL highly sensitive to downside liquidity sweeps. Technical chartists warn that a failure to defend initial pullback levels at $92 could accelerate secondary liquidation cascades toward the $80–$88 support zone.
This article may include AI-generated content that is human-reviewed, which is for reference and general information purposes only and does not constitute investment advice.
Recommended Articles









Comments (0)
Click the $ button, enter the symbol, and select to link a stock, ETF, or other ticker.