


NZD/USD (NZDUSD) Is down 0.53% on Aug 28: Why It Happened



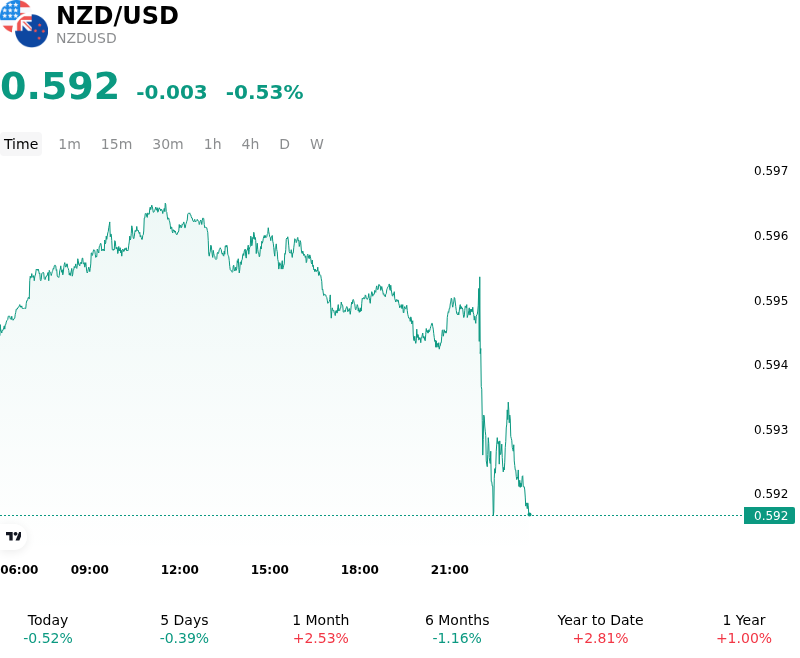
NZD/USD (NZDUSD) is down 0.53% at Aug 28 11:40(ET), now at $0.59158, with a 7-day down of 1.01%.
What is driving NZD/USD (NZDUSD)’s stock price down today?
The decline in NZDUSD reflects a combination of exhaustion in hawkish policy expectations for the Reserve Bank of New Zealand and a firming U.S. dollar backed by resilient front-end Treasury yields. While market participants had heavily priced in an upcoming rate hike from the RBNZ following elevated second-quarter inflation data, the room for further hawkish surprises proved limited. Recent domestic economic indicators—including softer retail sales, an uptick in unemployment, and subdued property market activity—have raised concerns regarding consumer demand resilience. Consequently, front-end New Zealand yields struggled to extend gains, triggering profit-taking and technical position unwinding in the Kiwi after its recent test of key resistance levels.
On the quote side, the U.S. dollar drew firm support from interest rate repricing and defensive positioning surrounding the Jackson Hole Economic Policy Symposium. Hawkish communications from Federal Reserve officials reiterated the persistence of underlying inflationary pressures, reinforcing market expectations of a prolonged period of elevated U.S. policy rates. This dynamic anchored U.S. Treasury yields and preserved an advantageous yield differential for the dollar. In response, institutional capital rotated out of pro-cyclical, commodity-linked assets and back into greenback liquidity, further exerting downward pressure on the pair.
From a macro perspective, the move appears to be a tactical adjustment rather than the start of a structural downtrend, driven by event-risk reduction and overextended positioning. However, investors will continue to monitor whether the RBNZ can deliver further rate hikes without deepening domestic economic softness, as well as the Federal Reserve's stance on monetary restriction, which remains the key driver of broader cross-currency rate differentials.
Technical Analysis of NZD/USD (NZDUSD)
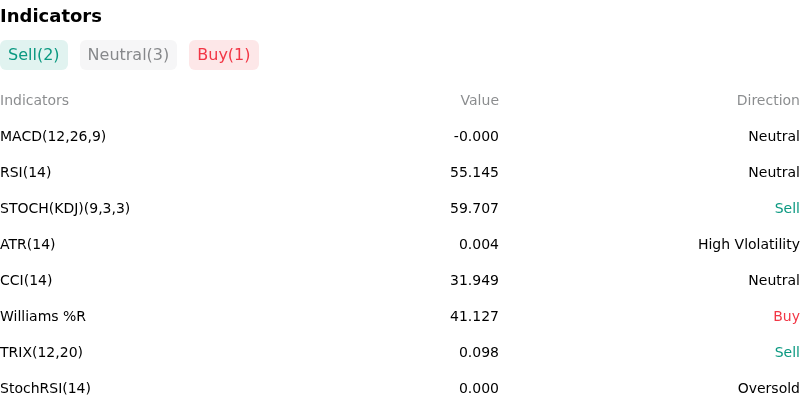
Technically, NZD/USD (NZDUSD) shows a MACD (12,26,9) value of -0.000, indicating a neutral signal. The RSI at 55.145 suggests neutral condition and the Williams %R at 41.127 suggests buy condition. Please monitor closely.
More details about NZD/USD (NZDUSD)
Recent Events and Risks:
- Exhaustion of RBNZ Hawkish Catalysts: Financial markets have fully priced in a 25-basis-point interest rate increase at the Reserve Bank of New Zealand's upcoming September meeting. With short positioning largely normalized and non-tradable inflation showing signs of cooling alongside rising domestic unemployment to 5.6%, institutional FX strategists warn that the central bank has limited room to deliver hawkish surprises, leaving the Kiwi vulnerable to momentum unwinding.
- Softening Domestic Demand and Retail Sales Weakness: Recent domestic economic data releases revealed weak underlying consumer demand, highlighted by softer-than-expected New Zealand retail sales volume and stagnant quarterly output growth. Elevated borrowing costs and cost-of-living pressures continue to constrain real disposable income, raising institutional concerns over New Zealand's growth trajectory and capping front-end yield support.
- Federal Reserve Re-pricing and US Yield Firming: Resilient US economic indicators alongside hawkish signals from Federal Reserve officials cautioning against persistent inflation have reinforced a higher-for-longer US rate outlook. Risk-off positioning ahead of key central bank policy speeches at Jackson Hole has prompted tactical capital rotation out of high-beta commodity currencies and into US Dollar liquidity, testing key technical resistance near 0.6000.
- External Imbalances and High-Beta Risk Sensitivity: New Zealand's current account deficit remains high in a global context at roughly 3.5% of GDP, keeping external liabilities elevated relative to peer economies. This fundamental vulnerability leaves NZDUSD highly exposed to global geopolitical frictions, energy market volatility, and risk-off shifts that trigger carry trade unwinds.
This article may include AI-generated content that is human-reviewed, which is for reference and general information purposes only and does not constitute investment advice.
Recommended Articles









Comments (0)
Click the $ button, enter the symbol, and select to link a stock, ETF, or other ticker.