


WTI (USOIL) Is down 2.03% on Aug 25: Here Is Why



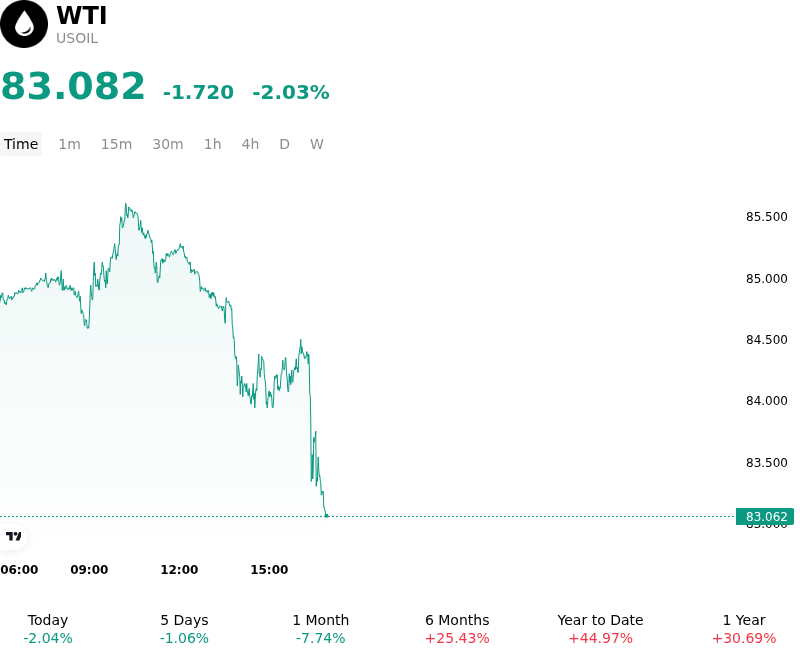
WTI (USOIL) is down 2.03% at Aug 25 04:55(ET), now at $83.082, with a 7-day down of 1.49%.
What is driving WTI (USOIL)’s stock price down today?
The downward pressure on West Texas Intermediate crude futures during the trading session primarily reflects a repricing of geopolitical risk premiums and technical profit-taking following a strong multi-week rally. Mounting expectations of diplomatic progress in the Middle East reduced immediate fears of severe regional supply bottlenecks and export disruptions, prompting market participants to trim the geopolitical premium that had previously driven prices higher. As the bullish impulse from supply disruption threats faded, institutional traders turned their focus toward broader market fundamentals and technical resistance levels, triggering long liquidation across speculative positioning.
Although threats of secondary sanctions on energy flows and ongoing maritime transit risks had provided support, the market's inability to sustain bullish momentum above key overhead resistance signaled exhaustion among buyers. Indications of active diplomatic mediation heightened expectations that aggressive sanctions enforcement or persistent transit blockades might be navigated or averted. With short-term supply risks failing to translate into immediate physical market deficits, the geopolitical premium contracted, leading leveraged funds and systematic managers to pare back net-long exposure.
From a fundamental perspective, the reduction in geopolitical risk exposes underlying market concerns regarding global demand health. Downward revisions to global oil demand growth projections by major energy institutions have capped upside momentum, as elevated fuel costs over recent months continue to exert a drag on end-user consumption and refinery intake. Coupled with recent builds in domestic commercial stockpiles and projections of expanding global supply over the coming quarters, the physical balance is shifting back toward supply adequacy. Market participants continue to closely monitor upcoming inventory data, foreign exchange volatility, and central bank policy signals to assess whether the retreat marks a short-term positioning shakeout or the beginning of a broader structural repricing lower.
Technical Analysis of WTI (USOIL)
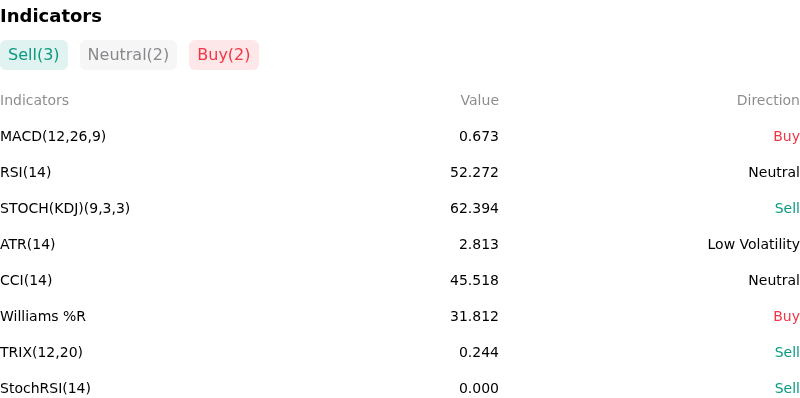
Technically, WTI (USOIL) shows a MACD (12,26,9) value of 0.673, indicating a buy signal. The RSI at 52.272 suggests neutral condition and the Williams %R at 31.812 suggests buy condition. Please monitor closely.
More details about WTI (USOIL)
Recent Events and Risks:
- Diplomatic Progress and Geopolitical Premium Unwind: Reports of progress in Pakistan-Iran diplomatic discussions and recent signals of increased tanker transits have prompted market participants to unwind embedded geopolitical risk premiums, triggering profit-taking and futures unwinding off multi-week highs.
- Global Demand Contraction and Macro Deterioration: Lingering macroeconomic softness in major consuming economies like China and the U.S., paired with IEA forecasts pointing to a 1.6 million bpd contraction in global oil demand for 2026, continues to undermine structural demand expectations and cap upside momentum.
- Substantial U.S. Crude Stockpile Builds: Official EIA inventory data confirmed a massive 17.4 million barrel surge in U.S. commercial crude stocks—the largest single-week build in over three years—highlighting localized domestic supply accumulation while total U.S. product demand contracted 2.1% year-over-year.
- Technical Resistance Rejection and Systematic Unwinding: WTI crude suffered a decisive rejection at its multi-month descending trendline near $86–$87 per barrel, establishing a bearish chart reversal pattern that has accelerated systematic long liquidation ahead of impending macroeconomic policy signals.
This article may include AI-generated content that is human-reviewed, which is for reference and general information purposes only and does not constitute investment advice.
Recommended Articles








Comments (0)
Click the $ button, enter the symbol, and select to link a stock, ETF, or other ticker.