


Corning Inc Stock (GLW) Moved Down by 3.14% on Aug 24: What Signal Does It Send?



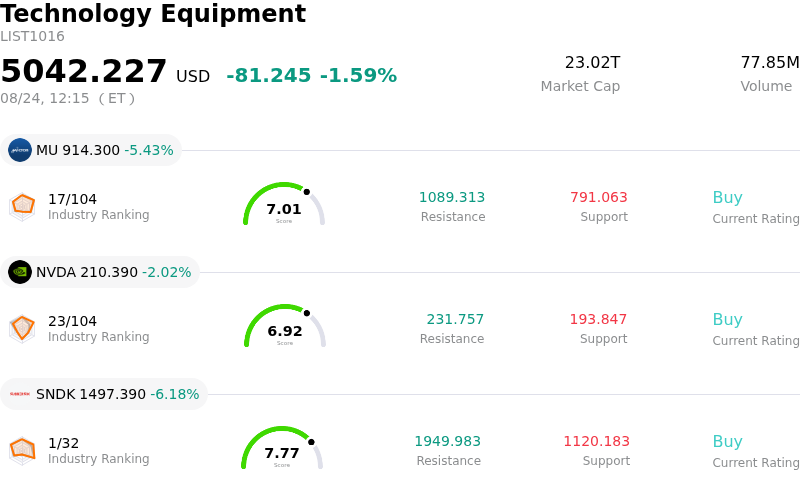
Corning Inc (GLW) moved down by 3.14%. The Technology Equipment sector is down by 1.59%. The company underperformed the industry. Top 3 stocks by turnover in the sector: Micron Technology Inc (MU) down 5.42%; NVIDIA Corp (NVDA) down 2.02%; SanDisk Corporation (SNDK) down 6.18%.
What is driving Corning Inc (GLW)’s stock price down today?
Corning Incorporated experienced downward price pressure and elevated intraday volatility primarily due to a broader sell-off across the optical networking and artificial intelligence hardware ecosystem. Sympathetic selling rippled through the sector following capital-raising disclosures from an optical components peer, which raised dilution fears and prompted institutional investors to trim exposure across elevated optical technology suppliers. Because Corning is closely associated with data center fiber infrastructure buildouts, its shares tracked the negative sentiment impacting the optics complex.
The weakness also reflects a lingering valuation recalibration following the company's recent quarterly earnings report. Although Corning reported solid top- and bottom-line figures supported by double-digit revenue expansion in its Optical Communications segment, management issued third-quarter sales guidance that fell slightly short of elevated market expectations. Investors who had priced in aggressive growth for data center connectivity solutions responded by reassessing forward revenue trajectories, leaving the stock vulnerable to profit-taking during sector-wide pullbacks.
Additional pressure stems from broader valuation concerns and institutional positioning. After a substantial rally driven by high-profile partnerships with major cloud providers and chipmakers, Corning trades at expanded price-to-earnings multiples relative to its historical averages. Persistent insider selling over recent months and minor demand uncertainties in consumer electronics specialty glass have further tempered near-term sentiment. While multiyear supply agreements solidify Corning's long-term thesis in generative AI infrastructure, short-term price movement remains tied to broader hardware sector volatility and multiple normalization.
Technical Analysis of Corning Inc (GLW)
Technically, Corning Inc (GLW) shows a MACD (12,26,9) value of 0.097, indicating a neutral signal. The RSI at 41.995 suggests neutral condition and the Williams %R at 90.003 suggests oversold condition. Please monitor closely.
Media Coverage of Corning Inc (GLW)
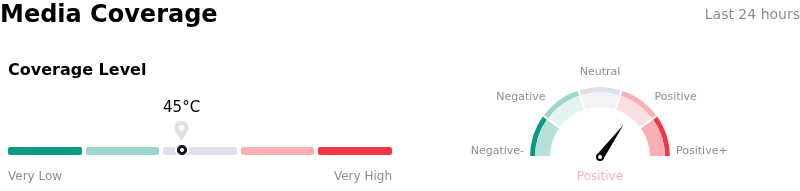
In terms of media coverage, Corning Inc (GLW) shows a coverage score of 45, indicating a moderate level of media attention. The overall market sentiment index is currently in bullish zone.
Fundamental Analysis of Corning Inc (GLW)
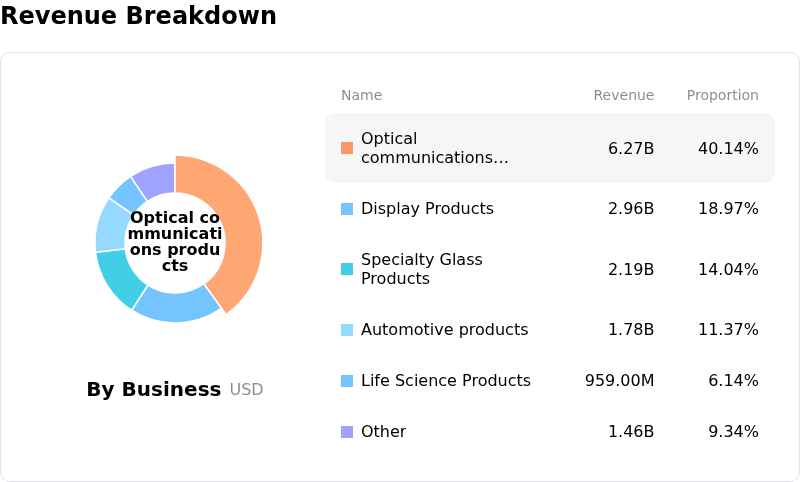
Corning Inc (GLW) is in the Technology Equipment industry. Its latest annual revenue is $15.63B, ranking 7 in the industry. The net profit is $1.60B, ranking 3 in the industry. Company Profile
Over the past month, multiple analysts have rated the company as Buy, with an average price target of $195.70, a high of $230.00, and a low of $129.00.
More details about Corning Inc (GLW)
Company Specific Risks:
- Analyst Downgrades and Target Price Cuts: Sell-side sentiment has softened following a fresh rating downgrade to "Hold" by Wall Street Zen on August 24, building on earlier steep price target cuts from major institutions such as Barclays (slashing its target to $129) and J.P. Morgan placing the stock on a Negative Catalyst Watch.
- High Valuation and Multiple Compression Risk: Despite a sharp pullback from its 52-week high of $271.78, Corning trades at elevated forward earnings multiples of over 50x, exposing the stock to aggressive intraday volatility and downward re-rating if AI-driven growth targets experience any deceleration.
- Hyperscaler Concentration and AI Capex Sensitivity: The company's primary growth engine—its Optical Communications segment—depends heavily on continuous capital expenditure for AI data centers by a small group of cloud hyperscalers, leaving revenues vulnerable to project timing delays or infrastructure spending cutbacks.
- Elevated Debt Obligations and Capex Demands: Carrying approximately $8.4 billion in total debt against $2.5 billion in cash alongside projected capital expenditures of $2.0 billion creates timing friction for free cash flow generation and leaves the balance sheet vulnerable to sustained high interest rates.
This article may include AI-generated content that is human-reviewed, which is for reference and general information purposes only and does not constitute investment advice.
Recommended Articles








Comments (0)
Click the $ button, enter the symbol, and select to link a stock, ETF, or other ticker.