


Texas Instruments Inc Stock (TXN) Moved Down by 3.32% on Aug 24: Facts Behind the Movement



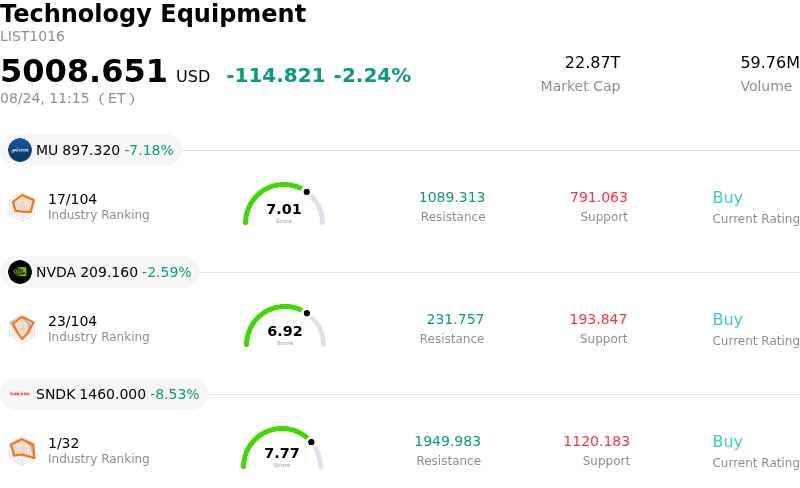
Texas Instruments Inc (TXN) moved down by 3.32%. The Technology Equipment sector is down by 2.24%. The company underperformed the industry. Top 3 stocks by turnover in the sector: Micron Technology Inc (MU) down 7.23%; NVIDIA Corp (NVDA) down 2.59%; SanDisk Corporation (SNDK) down 8.53%.
What is driving Texas Instruments Inc (TXN)’s stock price down today?
Texas Instruments experienced downside pressure as a wave of profit-taking swept through the semiconductor sector following an extended period of strong stock performance. Shares of the analog chipmaker had rallied significantly earlier in the year on expectations of an operational turnaround across industrial, data center, and automotive end markets. This sustained run elevated the company's valuation metrics relative to broader industry peers, making the stock increasingly sensitive to technology sector rotations as institutional investors sought to lock in gains.
From a fundamental perspective, market participants continue to balance the company's accelerating revenue recovery against its multi-year capital expenditure obligations. Although recent quarterly financial reporting highlighted a rebound in free cash flow and strong margin expansion, Texas Instruments maintains significant capital commitments toward expanding its domestic 300-millimeter manufacturing footprint. While these investments provide substantial long-term cost efficiencies and supply chain advantages, they also carry structural depreciation expenses that weigh on near-term cash flow metrics during periods of market scrutiny.
Looking ahead, the broader demand environment for analog and embedded processing chips remains solid, anchored by secular growth in data center buildouts, electric vehicle content, and stabilizing customer inventory levels. However, with much of the cyclical recovery already reflected in recent price gains, the stock's pullback reflects a market recalibration. Institutional adjustments and sector-wide sentiment shifts are compelling investors to demand a greater margin of safety between current trading levels and projected intrinsic cash flow generation.
Technical Analysis of Texas Instruments Inc (TXN)
Technically, Texas Instruments Inc (TXN) shows a MACD (12,26,9) value of -3.131, indicating a sell signal. The RSI at 34.761 suggests neutral condition and the Williams %R at 99.013 suggests oversold condition. Please monitor closely.
Media Coverage of Texas Instruments Inc (TXN)
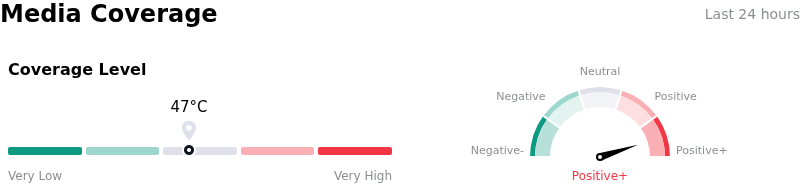
In terms of media coverage, Texas Instruments Inc (TXN) shows a coverage score of 47, indicating a moderate level of media attention. The overall market sentiment index is currently in extremely bullish zone.
Fundamental Analysis of Texas Instruments Inc (TXN)
Texas Instruments Inc (TXN) is in the Technology Equipment industry. Its latest annual revenue is $17.68B, ranking 14 in the industry. The net profit is $4.97B, ranking 10 in the industry. Company Profile
Over the past month, multiple analysts have rated the company as Hold, with an average price target of $0.00, a high of $0.00, and a low of $0.00.
More details about Texas Instruments Inc (TXN)
Company Specific Risks:
- Valuation Overhang and Premium Multiples: Following a strong year-to-date share price appreciation, discounted cash flow models and market multiple assessments indicate Texas Instruments is trading at a premium relative to its underlying cash flow outlook, making the stock highly susceptible to intraday profit-taking.
- Data Center Demand Sustainability and Competition: Institutional analysts express concern that the recent surge in data center power chip orders represents temporary customer pull-forward demand caused by competitor foundry bottlenecks rather than permanent market share gains, creating risks of revenue deceleration as competitors resolve capacity constraints.
- Fab Expansion Under-Utilization and Depreciation Charges: Heavy capital commitments to bring new 300mm domestic wafer manufacturing facilities online in Texas and Utah risk compressing operating margins through elevated fixed depreciation charges if industrial and automotive end-market order velocity lags behind new capacity additions.
- Elevated Dividend Payout Ratio Exposure: Maintaining a high dividend payout ratio relative to net income leaves a limited cash flow buffer if broader macro uncertainty delays analog chip recovery cycles, restricting financial flexibility during periods of capital expenditure deployment.
This article may include AI-generated content that is human-reviewed, which is for reference and general information purposes only and does not constitute investment advice.
Recommended Articles








Comments (0)
Click the $ button, enter the symbol, and select to link a stock, ETF, or other ticker.