


Cloudflare Inc Stock (NET) Moved Up by 3.94% on Aug 21: Key Drivers Unveiled



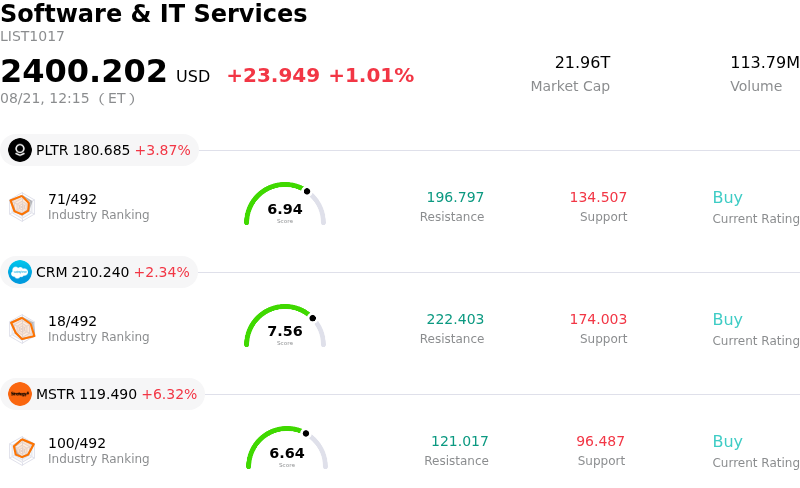
Cloudflare Inc (NET) moved up by 3.94%. The Software & IT Services sector is up by 1.01%. The company outperformed the industry. Top 3 stocks by turnover in the sector: Palantir Technologies Inc (PLTR) up 3.98%; Salesforce Inc (CRM) up 2.34%; Strategy Inc (MSTR) up 6.33%.
What is driving Cloudflare Inc (NET)’s stock price up today?
Cloudflare's upward price trajectory reflects sustained bullish momentum driven by strong second-quarter financial performance and an expanding growth narrative around artificial intelligence infrastructure. The company reported accelerating year-over-year revenue growth alongside raised full-year top-line guidance. A key driver behind this enthusiasm is the surge in non-human and AI agent web traffic, which recently crossed the threshold to represent over half of total network activity. Investors are increasingly pricing Cloudflare as an essential platform for machine-to-machine communications, developer tools, and security rails in an agentic internet environment, reinforcing long-term secular growth expectations.
Institutional sentiment received a boost as sell-side analysts across Wall Street revised their price targets upward to keep pace with the company's momentum. Furthermore, market digest of Cloudflare's capital raise via zero-coupon convertible senior notes was largely positive. Investors interpreted the debt issuance as a strategic move to bolster liquidity for future infrastructure investments without diluting equity value at current prices. Strategic operational milestones, including FedRAMP High Authorization for federal security workloads and key enterprise partnerships, have further solidified institutional support.
Despite the upward movement, significant intraday volatility points to active institutional rebalancing and tactical trading. High-multiple cloud infrastructure stocks remain exposed to broader macroeconomic shifts, Federal Reserve interest rate expectations, and tech sector sentiment. The premium valuation relative to historic multiples has prompted periodic profit-taking, particularly as recent insider Form 4 filings revealed routine stock sales executed under pre-established Rule 10b5-1 trading plans. Nevertheless, strong fundamental backing and expanding dollar-based net retention continue to provide a solid floor against broader market pullbacks.
Technical Analysis of Cloudflare Inc (NET)
Technically, Cloudflare Inc (NET) shows a MACD (12,26,9) value of -6.936, indicating a neutral signal. The RSI at 50.972 suggests neutral condition and the Williams %R at 73.229 suggests sell condition. Please monitor closely.
Fundamental Analysis of Cloudflare Inc (NET)
Cloudflare Inc (NET) is in the Software & IT Services industry. Its latest annual revenue is $2.17B, ranking 120 in the industry. The net profit is $-102.27M, ranking 537 in the industry. Company Profile
Over the past month, multiple analysts have rated the company as Buy, with an average price target of $331.21, a high of $400.00, and a low of $160.00.
More details about Cloudflare Inc (NET)
Company Specific Risks:
- Convertible Debt Dilution Concerns: Recent market digestion of Cloudflare's $2.175 billion offering of 0% convertible senior notes due 2031 has triggered heightened intraday price volatility, as institutional investors weigh potential future equity dilution and capital structure leverage against recent stock gains.
- Executive Insider Offloading: SEC Form 4 filings published on August 18–19 reveal continued executive stock sales, including transactions by Chief Accounting Officer Janel Riley and Chief Legal Officer Alissa Starzak, reinforcing negative sentiment surrounding heavy insider divestments totaling over $700 million over the past 12 months with zero insider purchases.
- Extreme Valuation Premium and Profit-Taking: Following a surge of over 50% across the past three months, the stock faces sharp intraday selling pressure due to valuation friction—highlighted by a forward P/E exceeding 220x and price-to-intrinsic value disconnects—as technical indicators exit overbought territory.
- GAAP Net Loss Expansion and Margin Compression: Analysts remain concerned by ongoing operational unprofitability, as recent quarterly reporting showed GAAP net losses widening year-over-year alongside gross margin compression to 73.1%, underscoring cost structure risks as network bandwidth demands scale.
This article may include AI-generated content that is human-reviewed, which is for reference and general information purposes only and does not constitute investment advice.
Recommended Articles












Comments (0)
Click the $ button, enter the symbol, and select to link a stock, ETF, or other ticker.