


Howmet Aerospace Inc Stock (HWM) Moved Down by 3.46% on Aug 20: What Signal Does It Send?



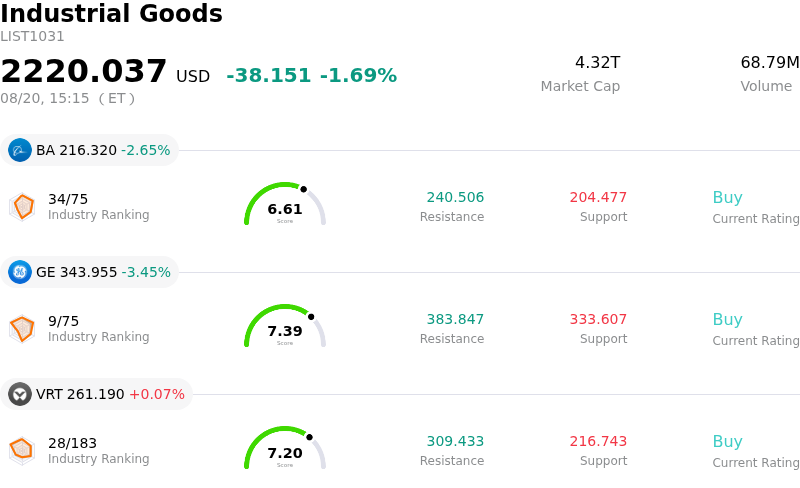
Howmet Aerospace Inc (HWM) moved down by 3.46%. The Industrial Goods sector is down by 1.69%. The company underperformed the industry. Top 3 stocks by turnover in the sector: Boeing Co (BA) down 2.65%; General Electric Co (GE) down 3.47%; Vertiv Holdings Co (VRT) up 0.07%.
What is driving Howmet Aerospace Inc (HWM)’s stock price down today?
Howmet Aerospace experienced notable intraday downward volatility as investors took profits following a strong multi-week rally driven by its recent second-quarter earnings beat. Although the company raised its full-year revenue and earnings outlook earlier in the month alongside a quarterly dividend increase, the stock had surged to high valuation multiples relative to historical averages and industry peers. Trading near record levels, the equity became increasingly susceptible to profit-taking as market participants reassessed risk-reward profiles in a broader environment of market volatility.
Fundamental scrutiny has also focused on the timing of capital deployment and production capacity expansion. Demand across commercial aerospace, defense spares, and industrial gas turbine blades remains resilient, supported by long aircraft order backlogs and energy demand. However, management's increased capital expenditure plans for facility expansions carry long lead times for specialized equipment. This dynamic pushes the financial acceleration of new capacity further into future quarters, creating brief headwinds as upfront capital investments precede revenue realization.
Additionally, broader pressure across high-multiple industrial names and post-earnings institutional portfolio rebalancing added to intraday selling. Concerns regarding potential supply chain bottlenecks among commercial aircraft original equipment manufacturers further encouraged traders to lock in gains. While the pullback reflects short-term valuation digestion and technical profit-taking, Howmet Aerospace maintains solid fundamental drivers through its dominant position in turbine components and strong exposure to growing defense programs.
Technical Analysis of Howmet Aerospace Inc (HWM)
Technically, Howmet Aerospace Inc (HWM) shows a MACD (12,26,9) value of -2.217, indicating a neutral signal. The RSI at 43.025 suggests neutral condition and the Williams %R at 98.033 suggests oversold condition. Please monitor closely.
Media Coverage of Howmet Aerospace Inc (HWM)
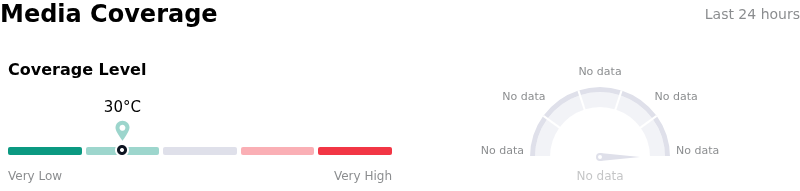
In terms of media coverage, Howmet Aerospace Inc (HWM) shows a coverage score of 30, indicating a low level of media attention. The overall market sentiment index is currently in extremely bullish zone.
Fundamental Analysis of Howmet Aerospace Inc (HWM)
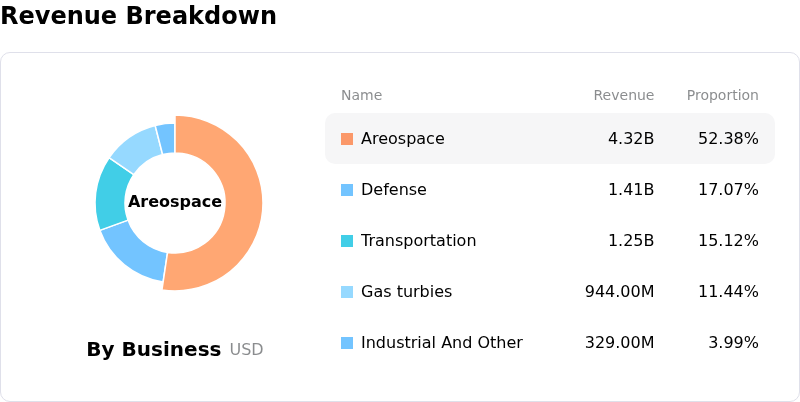
Howmet Aerospace Inc (HWM) is in the Industrial Goods industry. Its latest annual revenue is $8.25B, ranking 12 in the industry. The net profit is $1.51B, ranking 10 in the industry. Company Profile
Over the past month, multiple analysts have rated the company as Buy, with an average price target of $331.24, a high of $375.00, and a low of $214.92.
More details about Howmet Aerospace Inc (HWM)
Company Specific Risks:
- Valuation Premium and Multiple Compression Risk: Trading at a trailing P/E ratio above 60x—well exceeding its 5-year median of 43.3x and the Aerospace & Defense industry benchmark of ~39x—Howmet trades at a substantial valuation premium. This rich valuation exposes the stock to aggressive profit-taking and severe multiple compression if quarterly execution or macro sentiment falters.
- Capacity Expansion Lead Times and Ramp Costs: Capital expenditure commitments exceeding $500 million for 2026 to expand high-margin engine and turbine blade capacity face long machine-tool lead times of up to two years. This creates a back-ended revenue ramp and exposes operating margins to near-term underutilization costs if initial launch expenses normalize slower than projected.
- OEM Production Bottlenecks and Build Rate Dependency: Revenue growth in core structural and engine components relies heavily on aircraft build rates at primary OEM customers like Boeing and Airbus. Any production delays, supply chain bottlenecks, or delivery deferrals at these major manufacturers directly pressure Howmet's shipment volumes and cash flow delivery.
- Insider Selling Activity and Commercial Freight Softness: Disclosure data indicates significant net insider stock sales totaling $22.9 million over the past year with zero insider purchases. This executive divestment coincides with persistent volume softness in the commercial transportation segment (e.g., Forged Wheels), posing an ongoing drag on non-aerospace revenue streams.
This article may include AI-generated content that is human-reviewed, which is for reference and general information purposes only and does not constitute investment advice.
Recommended Articles










Comments (0)
Click the $ button, enter the symbol, and select to link a stock, ETF, or other ticker.