


TJX Companies Inc Stock (TJX) Moved Down by 3.07% on Aug 20: What Investors Need To Know



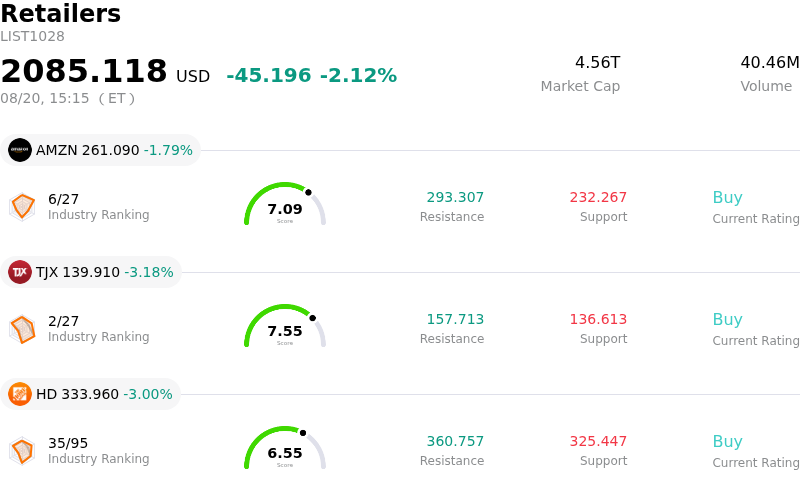
TJX Companies Inc (TJX) moved down by 3.07%. The Retailers sector is down by 2.12%. The company underperformed the industry. Top 3 stocks by turnover in the sector: Amazon.com Inc (AMZN) down 1.79%; TJX Companies Inc (TJX) down 3.18%; Home Depot Inc (HD) down 3.00%.
What is driving TJX Companies Inc (TJX)’s stock price down today?
The TJX Companies experienced downward price pressure following the release of its second-quarter fiscal 2027 financial results. Although the off-price retailer delivered top-line revenue and adjusted earnings per share that exceeded Wall Street consensus expectations, investor sentiment was weighed down by execution issues within its core business. Solid comparable store sales performance in HomeGoods, TJX Canada, and TJX International failed to fully offset a notable deceleration at Marmaxx, the flagship division housing T.J. Maxx and Marshalls. Management attributed the weakness at Marmaxx to self-inflicted merchandise mix and allocation missteps, but the division's sluggish comparable sales growth triggered concern over potential market share erosion.
Underneath the headline figures, institutional investors identified several underlying factors that constrained market enthusiasm. A non-trivial portion of the quarterly net profit beat stemmed from tariff refunds rather than underlying operational momentum, leading analysts to discount the quality of the earnings outperformance. Furthermore, while management raised its full-year pre-tax margin guidance and reaffirmed solid long-term store growth targets, the updated full-year adjusted earnings guidance fell slightly below high-end Wall Street projections. Concerns regarding second-half margin pressure from elevated freight and labor costs added another layer of near-term uncertainty.
Analyst commentary and broader market conditions further reinforced the downward trajectory. Following the earnings transcript, several sell-side research institutions revised their price targets lower and issued rating downgrades, citing balanced risk-reward dynamics and heightened competitive pressures from off-price and discount retail peers. Compounding stock-specific headwinds, widespread sector weakness across major U.S. retailers pressured consumer discretionary equities broadly, prompting short-term institutional profit-taking and portfolio adjustments.
Technical Analysis of TJX Companies Inc (TJX)
Technically, TJX Companies Inc (TJX) shows a MACD (12,26,9) value of -3.499, indicating a sell signal. The RSI at 25.685 suggests sell condition and the Williams %R at 99.955 suggests oversold condition. Please monitor closely.
Media Coverage of TJX Companies Inc (TJX)
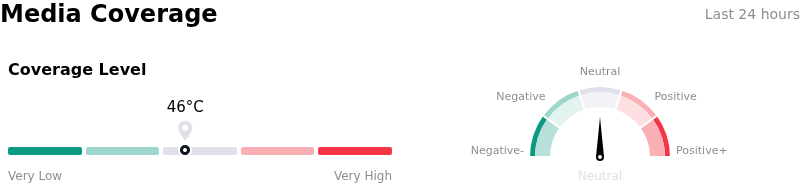
In terms of media coverage, TJX Companies Inc (TJX) shows a coverage score of 46, indicating a moderate level of media attention. The overall market sentiment index is currently in neutral zone.
Fundamental Analysis of TJX Companies Inc (TJX)
TJX Companies Inc (TJX) is in the Retailers industry. Its latest annual revenue is $60.37B, ranking 5 in the industry. The net profit is $5.49B, ranking 3 in the industry. Company Profile
Over the past month, multiple analysts have rated the company as Buy, with an average price target of $0.00, a high of $0.00, and a low of $0.00.
More details about TJX Companies Inc (TJX)
Company Specific Risks:
- Marmaxx Division Execution Miss: TJX's core Marmaxx segment (comprising T.J. Maxx and Marshalls) posted weak comparable store sales growth of just 1%, severely underperforming other business units. Management acknowledged "self-inflicted" merchandise mix and planning errors that depressed customer transaction counts, raising operational concern.
- Store Wage and SG&A Cost Inflation: Adjusted selling, general, and administrative expenses increased to 19.7% of sales, driven primarily by higher store wage inflation and payroll costs, exposing the company to margin compression from persistent operational overhead.
- Elevated Inventory and Markdown Exposure: Total inventory rose 7% year-over-year to $7.9 billion. Combined with merchandise mix errors in core apparel lines, higher inventory levels heighten the risk of promotional markdowns and margin dilution in upcoming quarters.
- Valuation Premium and Analyst Revisions: With the stock trading at a rich valuation of roughly 28 times trailing earnings, execution flaws at Marmaxx triggered immediate intraday stock declines and target price cuts from Wall Street analysts worried about second-half growth deceleration.
This article may include AI-generated content that is human-reviewed, which is for reference and general information purposes only and does not constitute investment advice.
Recommended Articles









Comments (0)
Click the $ button, enter the symbol, and select to link a stock, ETF, or other ticker.