


TJX Companies Inc Stock (TJX) Opened Down by 5.06% on Aug 19: Drivers Behind the Movement



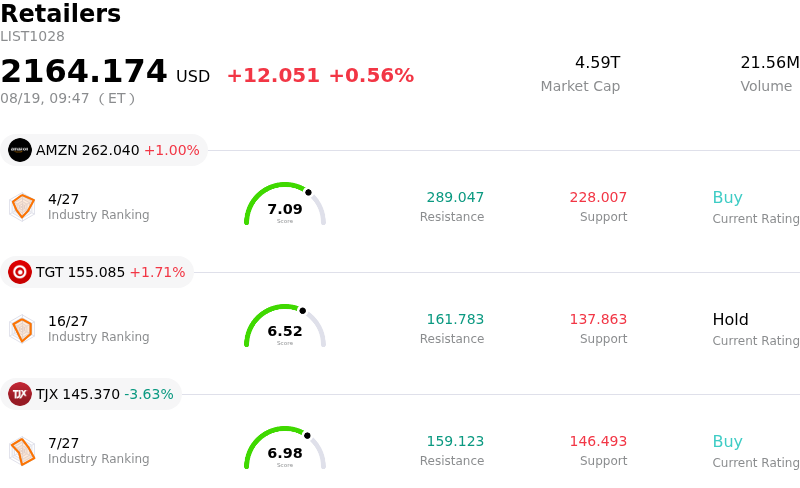
TJX Companies Inc (TJX) opened down by 5.06%. The Retailers sector is up by 0.56%. The company underperformed the industry. Top 3 stocks by turnover in the sector: Amazon.com Inc (AMZN) up 1.00%; Target Corp (TGT) down 2.79%; TJX Companies Inc (TJX) down 5.06%.
What is driving TJX Companies Inc (TJX)’s stock price down today?
Shares of The TJX Companies experienced noticeable downward pressure following the release of its second-quarter financial results. Although the off-price retail giant delivered solid top-line revenue growth and beat Wall Street consensus estimates on second-quarter adjusted earnings per share, market focus rapidly pivoted toward forward-looking projections and underlying divisional trends that fell short of heightened investor expectations.
A primary catalyst behind the sell-off was the soft earnings outlook provided for the upcoming third quarter. Management issued adjusted per-share earnings guidance for the third quarter that missed analyst estimates, raising concerns about potential margin pressure and near-term growth momentum. While the company raised its full-year profit outlook to reflect second-quarter outperformance and expected tariff refund benefits, the lighter near-term quarterly forecast signaled to investors that operational momentum could moderate in the second half of the fiscal year.
Underneath the headline figures, operational performance revealed notable divergence across store banners. While the HomeGoods segment alongside international divisions turned in robust comparable store sales gains, Marmaxx, which represents the company's core and largest U.S. operating division, delivered comparatively muted same-store sales expansion that trailed market expectations. The relative deceleration in Marmaxx raised questions regarding underlying consumer spending dynamics in core apparel categories and whether cost-conscious shoppers are becoming more selective with discretionary purchases.
Valuation dynamics and elevated market expectations also exacerbated the trading reaction. Heading into the earnings announcement, TJX had been trading near the upper end of its recent trading channel, leaving valuation multiples somewhat stretched relative to historical averages. With the equity priced for near-flawless execution, the combination of lighter third-quarter guidance and Marmaxx softness prompted institutional investors to lock in profits and temporarily rebalance exposure.
Technical Analysis of TJX Companies Inc (TJX)
Technically, TJX Companies Inc (TJX) shows a MACD (12,26,9) value of -1.875, indicating a sell signal. The RSI at 38.374 suggests neutral condition and the Williams %R at 96.360 suggests oversold condition. Please monitor closely.
Media Coverage of TJX Companies Inc (TJX)
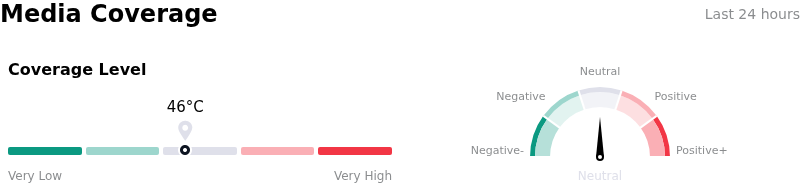
In terms of media coverage, TJX Companies Inc (TJX) shows a coverage score of 46, indicating a moderate level of media attention. The overall market sentiment index is currently in neutral zone.
Fundamental Analysis of TJX Companies Inc (TJX)
TJX Companies Inc (TJX) is in the Retailers industry. Its latest annual revenue is $60.37B, ranking 5 in the industry. The net profit is $5.49B, ranking 3 in the industry. Company Profile
Over the past month, multiple analysts have rated the company as Buy, with an average price target of $177.89, a high of $197.00, and a low of $124.89.
More details about TJX Companies Inc (TJX)
Company Specific Risks:
- Near-Term Guidance Disappointment: Despite beating quarterly expectations in its Q2 earnings release, TJX issued Q3 adjusted earnings-per-share guidance of $1.30 to $1.32 (excluding tariff refund net benefits), falling short of the Wall Street consensus estimate of $1.35 per share.
- Operating Expense and Wage Inflation Pressures: Financial details filed in the company's Form 8-K showed adjusted selling, general, and administrative (SG&A) expenses rising to 19.7% of sales, driven primarily by incremental store-level wage growth and payroll costs.
- Valuation Compression and Stretched Multiples: Trading at a premium price-to-earnings multiple of roughly 29.3x compared to the specialty retail industry average of 19.9x, the stock's elevated valuation leaves no margin of safety for operational slip-ups, leaving shares vulnerable to valuation downgrades.
- Expansion Execution and Inventory Carrying Risks: TJX announced plans to accelerate global store expansion toward a long-term 7,500-store goal while holding elevated inventory levels of $7.9 billion (up from $7.4 billion a year prior), heightening working capital exposure and execution risk if consumer demand slows.
This article may include AI-generated content that is human-reviewed, which is for reference and general information purposes only and does not constitute investment advice.
Recommended Articles











Comments (0)
Click the $ button, enter the symbol, and select to link a stock, ETF, or other ticker.