


Newmont Corporation Stock (NEM) Moved Up by 3.20% on Aug 14: What Signal Does It Send?



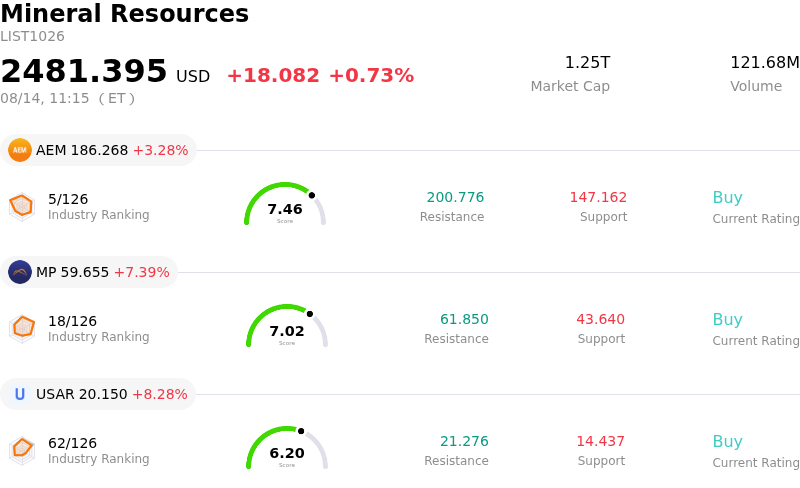
Newmont Corporation (NEM) moved up by 3.20%. The Mineral Resources sector is up by 0.73%. The company outperformed the industry. Top 3 stocks by turnover in the sector: Agnico Eagle Mines Ltd (AEM) up 3.28%; MP Materials Corp (MP) up 7.39%; USA Rare Earth Inc (USAR) up 8.28%.
What is driving Newmont Corporation (NEM)’s stock price up today?
The upward momentum in Newmont Corporation shares reflects a strong macro environment for precious metals, buoyed by recent economic data that eased Federal Reserve monetary tightening fears. Softer-than-expected inflation metrics, including consumer and producer price reports, have pressured Treasury yields and the U.S. dollar. This macroeconomic backdrop propelled spot gold prices higher, creating a favorable trading tailwind across the gold mining sector and invigorating buying interest in major producers like Newmont.
Adding momentum to the rally, corporate developments have removed key operational overhangs for the company. Newmont recently finalized a landmark settlement agreement with Barrick Mining Corporation to resolve lingering legal disputes over their joint venture in Nevada Gold Mines. The expanded agreement reorganizes governance and consolidates strategic properties under a unified operational framework, significantly de-risking asset execution risks and paving the way for streamlined capital allocation and potential asset listings.
Fundamental strength continues to underpin institutional demand following Newmont's recent quarterly financial performance. Despite localized operational hurdles and lower gold output, high realized metal prices allowed the company to generate record free cash flow. Management reaffirmed full-year production targets while actively returning capital to shareholders through dividends and aggressive share buybacks, supported by a cash-rich balance sheet with billions in liquidity.
Sell-side sentiment remains largely supportive, with several institutional research firms raising price targets on the back of resilient cash generation and improving sector dynamics. Although short-term profit-taking created brief intraday volatility earlier in the week, strong fundamental support and dip-buying by institutional investors pushed the stock higher, signaling robust market confidence in Newmont's multi-year earnings potential.
Technical Analysis of Newmont Corporation (NEM)
Technically, Newmont Corporation (NEM) shows a MACD (12,26,9) value of 5.185, indicating a buy signal. The RSI at 67.829 suggests neutral condition and the Williams %R at 19.225 suggests overbought condition. Please monitor closely.
Media Coverage of Newmont Corporation (NEM)
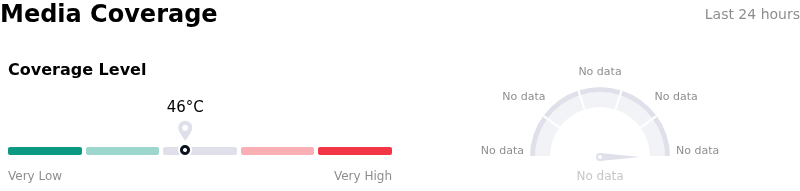
In terms of media coverage, Newmont Corporation (NEM) shows a coverage score of 46, indicating a moderate level of media attention. The overall market sentiment index is currently in extremely bullish zone.
Fundamental Analysis of Newmont Corporation (NEM)
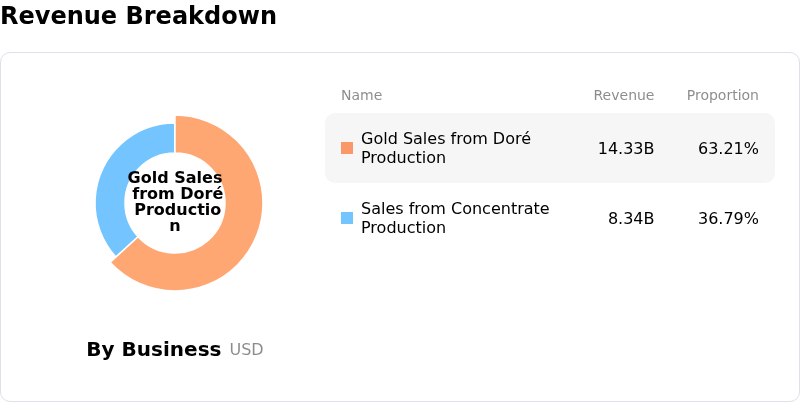
Newmont Corporation (NEM) is in the Mineral Resources industry. Its latest annual revenue is $22.67B, ranking 8 in the industry. The net profit is $7.08B, ranking 3 in the industry. Company Profile
Over the past month, multiple analysts have rated the company as Buy, with an average price target of $132.17, a high of $205.00, and a low of $64.32.
More details about Newmont Corporation (NEM)
Company Specific Risks:
- Substantial Cash Outflow for JV Restructuring: Under the second amended Nevada Gold Mines joint venture agreement disclosed in SEC Form 8-K filings on August 10, 2026, Newmont is committed to a $1.95 billion cash payment to Barrick within 30 days to fold excluded assets into the venture. This major cash outlay poses near-term liquidity demands and increases corporate execution risk.
- Margin Compression from Back-Loaded Capital Spending: Company guidance indicates that the second half of 2026 will absorb 58% of annual sustaining capital expenditure and 63% of development capital expenditure, despite gold production being weighted only modestly at 51%. Expected unit cost increases and capex acceleration in Q3 threaten near-term operating margins and free cash flow generation.
- Persistent Executive Insider Selling: SEC filings from early August 2026 reveal coordinated share liquidations by key leadership, including CFO Brian Tabolt, CEO Natascha Viljoen, and EVP Peter Toth. Ongoing insider divestment during periods of stock price strength signals internal caution regarding near-term equity performance.
- Overvaluation Premium and Institutional De-risking: Independent valuation metrics highlight that the stock trades at an over 40% premium relative to intrinsic valuation estimates. This fundamental stretch has triggered institutional profit-taking and intraday volatility as traders trim exposure to high-beta mining equities.
This article may include AI-generated content that is human-reviewed, which is for reference and general information purposes only and does not constitute investment advice.
Recommended Articles








Comments (0)
Click the $ button, enter the symbol, and select to link a stock, ETF, or other ticker.